


Services on Demand
Journal

Article
 English (pdf)
 Article in xml format
 Article references
 Send this article by e-mail
Indicators
Related links
-
 Cited by Google
 -
 Similars in Google
Share

 Permalink
South African Journal of Industrial Engineering
On-line version ISSN 2224-7890
S. Afr. J. Ind. Eng. vol.35 n.1 Pretoria May. 2024
https://doi.org/10.7166/35-1-2899
GENERAL ARTICLES
Applying six sigma to improve the defect rate of electronic components: a six sigma case study
P.H. Fan*
Department of Industrial Engineering and Management, Minghsin University of Science and Technology, Taiwan, Republic of China
ABSTRACT
This study aimed to improve the touch responses of electronic products. The improvement method was based on six sigma improvement steps. Product quality was improved using define, measure, analyse, improve, control (DMAIC) and statistical quality control methods to reduce the cost and waste of defective products. The project identified five critical processes from the manufacturing process and eight critical to characteristics (CTCs). Then CTCs were identified through the critical to characteristic diagram. The root causes were verified using the experimental plan method, scatter diagram, and double ratio test. This study identified three root causes, namely 'poor reed touch value', 'base cavity width', and 'jig precision'. The last two causes were evaluated, and countermeasures were taken to 'change the size of the base cavity', 'change the design of the assembly jig', and 'change the process of the assembly jig'. The target rate of the overall product defect rate reached 127%.
OPSOMMING
Hierdie studie het ten doel gehad om die aanraakreaksies van elektroniese produkte te verbeter. Die verbeteringsmetode was gebaseer op die ses sigma verbeteringstappe. Produkgehalte is verbeter deur gebruik te maak van definieer, meet, analiseer, verbeter, beheer ("DMAIC") en statistiese gehaltebeheermetodes om die koste en vermorsing van gebrekkige produkte te verminder. Die projek het vyf kritieke prosesse uit die vervaardigingsproses geïdentifiseer en agt kritieke tot kenmerke (CTC's). Daarna is CTC's geïdentifiseer deur die krities-tot-kenmerkende diagram. Die oorsake is geverifieer deur die eksperimentele planmetode, verstrooiingsdiagram en dubbelverhoudingtoets. Hierdie studie het drie hoofoorsake geïdentifiseer, naamlik 'swak roerdotswaarde, 'basisholtebreedte' en 'klem akkuraatherid'. Die laaste twee oorsake is geëvalueer, en teenmaatreëls is getref om 'die grootte van die basisholte te verander', 'die ontwerp van die samestellingshulpstuk te verander', en 'die proses van die samestellingshulpstuk te verander'. Die teikenkoers van die algehele produkdefektesyfer het 127% bereik.
1. INTRODUCTION
1.1. Research motives
The global electronics industry, including computer, communication, consumer electronics (3C) and home electronics, experienced rapid growth in 2000 owing to the rise of smartphones and the introduction of tablet computers [1]. These handheld communication and mobile wireless devices, combined with traditional computer fixed-network devices, are connected through the internet, and drive the new era of the Internet of Things (IoT). Moreover, the development trend of robotics, autonomous driving, smart home, cloud, and big data has also confirmed the continual development of the electronics industry in the future.
Taiwan is the world's leading manufacturer of electronic products, and the electronics industry has been booming for the past two decades. Business concepts, manufacturing technology, production management, quality assurance, and product reliability have been continuously improved. 'Made in Taiwan' (MIT) products have also become synonymous with quality assurance. The year 2000 can be seen as a watershed in developing quality activities in Taiwan. Total quality management (TQM) related activities were the focus before 2000; the main activities were related to six sigma and lean production or the Toyota production system (TPS) [2]. At the same time, most of Taiwan's electronics industry has gone to the China to invest and set up factories. With Taiwan as the R&D centre and China as the manufacturing production line, product quality is relatively unstable.
The target of improvement in this study was the tactile switches of 3C products. Tactile switches are one of many switches on printed circuit boards (PCBs), and are widely used in electronic components. They are often used to control electronic products' power on and off, such as medical devices, cell phones, and remote controls. They are widely used in electronic devices because of the advantages of low contact resistance load, low force error, and various specifications. Therefore, it is necessary to improve the process yield and to reduce the defect rate in order to decrease customer complaints and reduce loss. Six sigma is a scientific management model that is based on data and is customer-oriented; it adopts a process perspective and the concept of continuous improvement to improve product process efficiency and effectiveness, thereby increasing customer satisfaction and profitability [3]. Therefore, this study used six sigma activities as examples for improving defective tactile switches.
2. LITERATURE REVIEW
Six sigma is a management technique developed by Motorola in the 1980s. In 1981, Motorola's chief executive officer (CEO) Bob Galvin had asked the company to improve its performance tenfold within five years. Bill Smith, an engineer in the communications division, proposed the idea of six sigma, which required the company to achieve a quality level of 3.4 ppm. As a result of General Electric's E CEO Jack Welch promoting six sigma, GE generated billions of dollars in savings over five years. That impressive performance established six sigma management as a trend in the United States business world [4].
Six sigma is a complete improvement procedure. If the object for improvement is an existing process, the define, measure, analyse, improve, control (DMAIC) phases can be adopted; if the objective is to design a new product/service or to redesign a current product/service, the define, measure, analyze, design, validate (DMADV) phases may be used, as shown in Figure 1. Banuelas et al. (2005) consider six sigma an effective problem-solving strategy [5]. The key success factors of a six sigma project can be summarised as management input and commitment, the selection of items related to corporate goals, training and teamwork, and project progress tracking and monitoring.

Many senior executives want to use six sigma projects to solve the problems that their companies face. However, implementing six sigma is often unfocused. A company's resources are relatively limited, making it difficult to ensure that the project team could find projects that would have a critical impact on the company. The solution is to integrate the six sigma project with the organisation's strategic planning in order to enable the company to achieve breakthrough results in its strategies. Therefore, it is necessary to Integrate six sigma and corporate strategy planning methods to ensure that six sigma projects significantly benefit the company, leading to opportunities for cultural change and breakthrough innovation [6].
Implementing six sigma in Taiwan began around 1990 when the headquarters of Motorola required its Taiwan branch to implement six sigma improvement activities. Real progress occurred around 2000. In addition to GE Medical Systems introducing six sigma, Taiwanese government units established projects to assist companies in implementing six sigma activities [1].
3. METHODOLOGY
This study aimed to improve defective products in the existing manufacturing process. Therefore, the five DMAIC phases were used [7]. The content of each step is shown in Table 1.

Define phase: During this phase, we identified improvement opportunities for the project and clearly defined the problem and its scope. First, we completed the project charter, which consisted of the purpose, problem description, objectives, problem scope, project planning, member selection, and estimated benefits. These items can be evaluated and selected, based on customer needs and the company's strategic goals. The sources for selection include corporate external sounds and internal processes. External sources, such as customer complaints and market competition, and internal sources, such as a high defect rate, heavy production, and cost waste, were the basis for selection.
Measure phase: The primary purpose of this phase was to evaluate and understand the current process status, to select the critical-to-quality characteristics (CTQ), and to convert the CTQ to list critical process output variables. The measurement system was first verified to confirm that the data collected and the results of the measurements were correct and could be trusted.
Analysis phase: In this phase, the data collected during the measure phase were presented via tools and methods to identify the root cause of the problem. Using the cause-and-effect diagram, we analysed critical causes and investigated the variation in the quality characteristics from 5M1E, including the workforce, machinery, materials, methods, measurement, and environment. Then we verified the true causes with common tools such as control chat, hypothesis testing, and regression analysis.
Improve phase: This phase involved selecting and implementing the most cost-effective solution in order to improve the system process, eliminate the root cause of the problem, reduce variability, and prevent a recurrence of the problem. The experiment design was the most important statistical tool during this phase. By thoroughly planning the combination of experiments, we could effectively measure the degree of influence between factors, decide which factors affected the process results, and determine the best combination of factors.
Control phase: The improved process, related operational standards, and training documents were adequately communicated to the actual process operators to maintain the improved results. It had to be monitored continuously to ensure that the improved system was effectively and stably maintained. The experience and results obtained during the project improvement process were extended horizontally and applied to other organisational processes in order to achieve continuous improvement.
Companies use the six sigma DMAIC methodology to enhance processes, and immediate and noticeable improvement results can be achieved from the application and analysis of statistical techniques. However, it is gradually realised that there are limits to the extent of these improvements, and achieving a quality level satisfactory to customers is quite difficult. It becomes necessary to redesign processes such as products, procedures, and services in order to exceed customers' expectations in quality, cost, lead time, and service, thereby delighting customers. This design process is referred to as 'design for six sigma' (DFSS).
Unlike the standardised DMAIC improvement steps in six sigma, DFSS does not have a universally recognised set of process steps. DMADV and identify, design, optimize and verify (IDOV) are currently the most common methods. DMADV is the most commonly used DFSS method, consisting of five steps: define, measure, analyse, design, and verify. IDOV is widely applied in the manufacturing industry, comprising four steps: identify, design, optimise, and verify [6].
4. CASE ANALYSIS RESULTS AND DISCUSSION
The subject of this study was a professional supplier of laptop batteries. This company had been receiving requests from customers to improve the process yield and to decrease the product defect rate, so as to reduce the number of customer complaints and wear and tear.
4.1. Define phase
In the define phase, we first sought to understand the defect phenomena that customers valued, and discovered that the main complaints from customers were about highly defective products A and B after assembly. Then we used a matrix diagram to select the improvement project and understand the current situation, as shown in Table 2 and in Figures 2 and 3. The defect rate of Product A was 7%, and for Product B it was 5.36%. Finally, the theme of this project was defined as 'Defect improvement for Product A'.


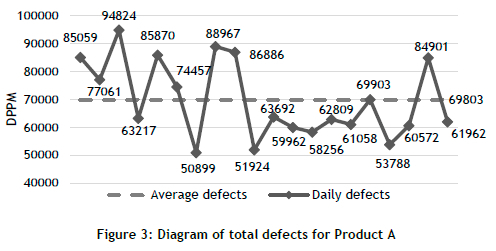
Gathering data about to the number of defective components yielded during a continuous 20-day period of Product A's manufacturing process, we found that the derived average defect was 69 803 defects per million (DPPM), as shown in Figure 3.
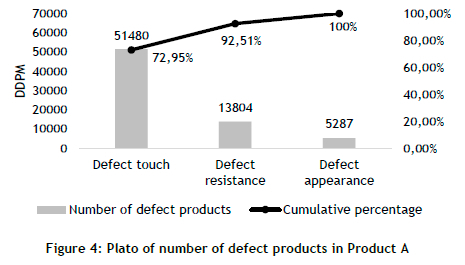
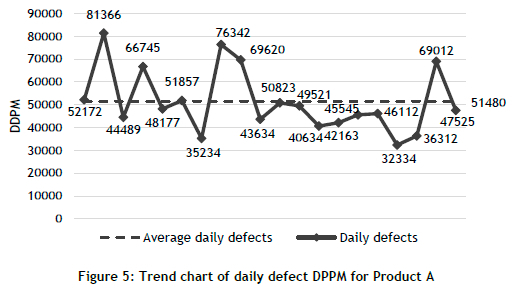
We then used a Plato analysis to determine the critical items for improvement. The percentage of defective items in the total number of items was found to be 70%~80%, and the direction for improvement was prioritised. Internal data collection at the factory showed that 72.95% of the total defective parts were caused by defect touch, as shown in Figure 4. This important item was a waste of money for the company. Thus we selected defect touch as the target for improvement. Figure 5 shows that the average daily defect touch was 51 480 DPPM.
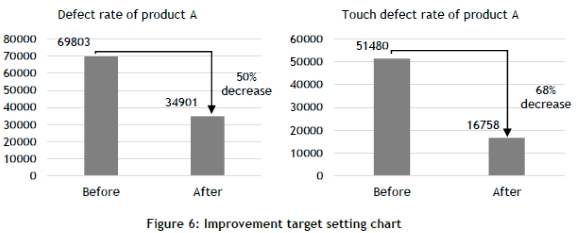
Regarding the improvement target, according to the company's management policy, the defect rate needed to be reduced by 50%. Therefore, the touch defect rate of Product A had to be reduced by 68% to achieve the result, as shown in Figure 6.
4.2. Measure phase
In the measure phase, the CTQs were identified through an inventory of the current process status (see Figure 7). The CTQs were converted into a list of critical process output variables. After the critical improvement process was determined, the CTC was identified in the measure phase, as shown in Table 3. What was important to monitor in the process was determined by grasping the CTC. Then the measurement system analysis was performed for the CTC, as shown in Table 4. Gage repeatability and reproducibility (Gr&R) is defined as the process that is used to evaluate a gauging instrument's accuracy by ensuring that its measurements are repeatable and reproducible. The process includes taking a series of measurements to certify that the output is the same value as the input, and that the same measurements are obtained under the same operating conditions over a set duration. GR&R < 10% is acceptable for the measurement system; GR&R > 10% and < 30% would mean that the measurement system may be acceptable, depending on the needs of the process, or on the risk and cost to determine whether further improvements are needed. If GR&R > 30%, the measurement system is not acceptable. The result was that the personnel and testing equipment of the measurement system was reliable and stable without causing variation. The process capability of the measurement indicators was also assessed judged; the eight identified indicators showed insufficient process capability and needed to be improved. Take the complex process capability (CPK) index as an example: the main investigation is into long-term manufacturing capacity, for which the index needs to be greater than at least 1.33 to represent a stable manufacturing capacity. When the CPK is greater than 1.5, it is equivalent to six sigma. As shown in Table 5, the status of all of the measurement indicators for process capability had not been achieved.


4.3. Analysis phase
In the analysis phase, the manufacturing staff, R&D engineers, and quality assurance supervisors brainstormed to develop a CTC diagram based on personnel, equipment, material, method, measurement, and environment, and finally selected seven CTCs, as shown in Figure 8. Then an action plan to identify the root cause was developed for these seven CTCs, as shown in Table 6.


4.3.1. Identify the root cause 1-1
A multi-level factorial design was implemented for the causes of 'poor push handle bump size', 'poor base cavity width', and 'poor reed feel value', as shown in Table 7. Four repeated experiments were performed for three factors, so the total number of experiments was 48, as shown in Table 8. The reed p-value = 0.011 < 0.05, as shown in Table 9. The reed touch value was determined to be the root cause because it had the greatest effect on the finished product touch value (Figure 9), with significant differences. However, the interaction of the three factors was not significant (Figure 10), and it was not possible to determine the best value for the combination of the three factors.


4.3.2. Identify the root cause 1-2
The reed had the most influence on touch in the experimental identification results. However, from past experience and discussions with experienced operators and quality assurance units in the field, in addition to the reed affecting the quality of the touch, the gap between the reed and the base also affects the touch. Thus the base cavity width was re-identified, as shown in Table 10. The p-value = 0.002 < 0.05 was obtained from the double ratio test. Therefore, the base cavity width was related to the defect touch rate of the finished product, and was a root cause.

4.3.3. Identify the root cause 2
The 'base positive drop', 'base negative drop', and 'base cavity depth' were plotted against the 'touch value' in a scattering diagram to identify the root cause. The conclusion was that these three factors were not correlated with the touch value, as shown in Figure 11; so they were not considered to be the root causes.

4.3.4. Identify the root cause 3
The jig was modified to verify the correlation between jig precision and the defect touch rate of the finished product. The result is shown in Table 11. The more than double ratio between two and four positioning holes was tested, and the p-value = 0.021 < 0.05. Therefore, the correlation between the precision of the jig was related to the defect touch rate of the finished product, and jig precision was a root cause.

Conclusion: The results of the identification of the root cause yielded three true causes, namely 'poor reed touch value', 'base cavity width', and 'jig precision'.
4.4. Improve phase
During the improve phase, team members brainstormed the three root causes of the problem in the analysis phase and formulated the countermeasures shown in Table 12. Regarding the countermeasure of poor reed touch value, since it was a seller's market, and no other supplier could be found for a short period, no improvement would be made after the evaluation. Countermeasures were proposed for the other two causes.

The countermeasure for the root cause of 'base cavity width' was 'change in product design, modification of base cavity width dimensions'. In the trial effect of improving the touch value of the assembled finished products with the base cavity size, the touch value of Product A decreased from 51 480 ppm to 20 390 ppm. The overall defect rate decreased from 69 803 ppm to 33 950ppm, and the countermeasure was effective, as shown in Figure 12.

The countermeasures for the true cause of 'jig precision' were divided into two stages: the first stage was 'change in the design of assembly fixture to increase the positioning accuracy, use of ball guide column and guide bush; and change of material from fireless material to hardened material to increase the wear resistance'. The countermeasure in the second stage was a 'change in the machining process of assembly jig from CNC machining to slow-wire machining'. After introducing the countermeasures, the effect of the touch value of Product A decreased from 51,480 ppm to 15,992 ppm and then evolved to 12,230 ppm. The countermeasure was effective, as shown in Figure 13.

4.5. Control phase
After we had confirmed that the improvement measures could achieve the results in the improve phase, the standardised operation was adopted. Figure 14 shows that the target achievement rate of the overall defect rate of Product A was 127% and the improvement rate was 63.7%; the target achievement rate of the touch defect rate of Product A was 112%, and the improvement rate was 76.3%. The process capability index of base cavity size improved from CPK=0.68 before improvement to CPK=1.28 after improvement. The process capability index of the in-process touch value improved from CPK=1.16 to CPK=1.78. The overall and touch defect rates were tracked continuously using the P-chart control chart, as shown in Figures 15 and 16. The defect rates were within the control limit, and the improvement target was achieved.


5. CONCLUSION AND SUGGESTIONS
This study used the DMAIC phases of six sigma to improve defective electronic component tactile switches. First, in the define phase, the assembly structure of the product was clarified, and the problem to be solved was the product's poor touch and key process areas, as per customer feedback. In the measure phase we analysed the measurement system for the identified CTCs, which was stable. Further analysis revealed three true causes, namely 'poor reed touch value', 'base cavity width', and 'jig precision'. Only the last two true causes were considered in the improvement countermeasures, as the problem with the reed supplier could not be solved quickly. We compared the set targets with the effectiveness in the final control phase. The target rate of overall defect rate reached 127%, the target rate of the touch defect rate reached 112%, and the process control showed stable and controllable results.
After a complete process improvement, the case company reduced the defect rate and adopted a comprehensive and effective improvement process and procedure, which was a significant benefit for the company. In fact, through this project, we found that most of the defects in the assembled products were related to the structure of the products, including the rigour of the product design specifications and the tooling precision. This finding indicates that the product design affected the result, and suggests that quality control should be practised by the source management.
REFERENCES
[1] Wang, Z.H. (2015). History of quality development in the Republic of China. Taipei, Taiwan: CSQ. [ Links ]
[2] Yang, C.C. (2004). An integrated model of TQM and GE-Six-Sigma. International Journal of Six Sigma and Competitive Advantage, 1(1):97-111. [ Links ]
[3] Pande, P.S., Neuman, R.P. & Cavanagh, R.R. (2006). What is design for Six Sigma? Taipei, Taiwan: McGraw Hill. [ Links ]
[4] Bossidy, L., Charan, R. & Burck, C. (2002). Execution: The discipline of getting things done. New York: Crown Business. [ Links ]
[5] Banuelas, R., Antony, J. & Brace, M. (2005). An application of six sigma to reduce waste. Quality and Reliability Engineering International, 21:553-570. [ Links ]
[6] Hunt, R.A. & Xavier, F.B. (2003). The leading edge in strategic QFD. International Journal of Quality & Reliability Management, 20(1):56-73. [ Links ]
[7] Pande, P.S., Neuman, R.P. & Cavanagh, R.R. (2001). The six sigma way team fieldbook. New York: McGraw Hill. [ Links ]
Submitted by authors 2 May 2023
Accepted for publication 28 Apr 2024
Available online 31 May 2024
* Corresponding author: garyfan1688@gmail.com
ORCID® identifiers
P.H. Fan
https://orcid.org/0000-0002-7693-2301
