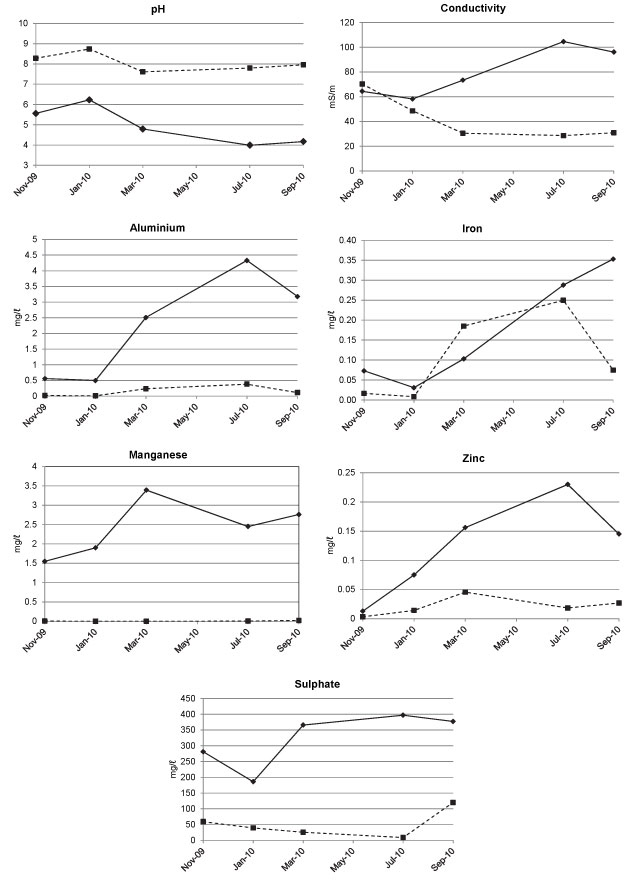
Figure 7
Time series plots of pH, conductivity, metals (aluminium, iron, manganese and zinc) and sulphate measured in the Klipspruit (10_KLI; solid line) and Steenkoolspruit (3_STK; dashed line) rivers during 2011.