


Services on Demand
Journal

Article
 English (pdf)
 Article in xml format
 Article references
 Send this article by e-mail
Indicators
Related links
-
 Cited by Google
 -
 Similars in Google
Share

 Permalink
South African Journal of Science
On-line version ISSN 1996-7489Print version ISSN 0038-2353
S. Afr. j. sci. vol.121 n.7-8 Pretoria Jul./Aug. 2025
https://doi.org/10.17159/sajs.2025/20502
RESEARCH ARTICLE
Funding South Africa's food and nutrition policy: Estimates for the 2018-2022 funding cycle
Peter T. JacobsI; Vandudzai MbandaII; Sisonke MtyapiI
IEquitable Education and Economies, Human Sciences Research Council, Cape Town, South Africa
IIEquitable Education and Economies, Human Sciences Research Council, Pretoria, South Africa
ABSTRACT
Securing enough funds to roll out South Africa's National Food and Nutrition Security Plan (NFNSP) has gained renewed momentum since 2017 when projections of cost to deliver on its outcomes were determined. Funding to implement the policy during the initial 5-year cycle (2018-2023) also involved identifying sources from which to finance actual policy actions as well as strategies to close funding gaps. Against the backdrop of global debates on food assistance financing, we used an elementary funding gap equation for a systematic calculation of the funds needed for NFNSP. To determine available funding sources, we built a unique data set based on historical spending information for 2018-2022. A key finding is that national and subnational government departments dominate funding sources for food and nutrition policy activities. Unlike poorer countries, non-state donors make ad hoc and smaller contributions, but this source of food and nutrition assistance is less accessible. Aggregation over all available funding sources reveals that authorities only met 50% of the Plan's funding needs after 4 years and thus fell short of meeting its 2017 target. Our findings reinforce the case to urgently strengthen the principles, design and implementation systems for adequate food and nutrition policy spending.
SIGNIFICANCE:
• In middle-income countries like South Africa, a holistic approach to financing food and nutrition policy is essential to achieve its constitutionally protected food rights and Sustainable Development Goals (SDGs) imperatives.
• Results and insights demonstrate the effective use of a straightforward method to document and monitor the financing of food and nutrition assistance in the absence of a standardised methodology.
• Conclusions guide innovations in anti-hunger activism grounded in evidence with benefits that cascade into intersecting policy domains.
• This article enriches thinking and practices in transformative social protection and equitable fiscal policy for higher human well-being outcomes.
Keywords: food value chains, food assistance, funding gaps, food and nutrition policy
Introduction
This article contributes to finding practical options to finance South Africa's food and nutrition security plan based on costing targets that the government first developed in 2017. Compared to the country's history of delayed and disjointed reactions to hunger, the 2017 National Food and Nutrition Security Plan (NFNSP) with its cost estimates heralds a shift in the right direction. This plan endeavours to better coordinate implementation across its diverse strategic objectives (SOs), a positive spin-off from the integrated approach which underpins the NFNSP More importantly, it emphasises the need to secure enough funds to cover its estimated costs but stops short of identifying sources to finance the forecasted expenditure. Also absent from the NFNSP and previous studies is what amount of funding is likely to be secured from private donors, multilateral aid agencies and public finances in the fiscus. To help fill this knowledge gap, this article explains how to construct an integrated approach to determine funding gaps in the NFNSP and to identify potential sources to finance these gaps.
In 2013, the South African cabinet adopted a new food and nutrition security policy, thus heralding a step forward when comparing its content and operational vision to that in the previous policies it replaced.1,2 Comparisons of the 2013 National Policy on Food and Nutrition Security (hereafter referred to as the 2013 Policy) with the 2002 policy framework have highlighted compelling queries, such as questioning the intensity of grassroots participation in its development3 to its conceptual premises4-6. Older food policy frameworks, such as the 2002 Integrated Food Security Strategy and a chapter in the 2012 National Development Plan, were rooted in total farm output thinking. It reduced food security to the quantity of primary agricultural production in the country. However, crop and livestock outputs from South African farms are increasingly exported, thus negating presumptions that domestic agrofood outputs would automatically ensure adequate food for everyone who resides in the country.7 Food policy reduced to the quantity of crops and livestock produced within the borders of the country is unrealistic, one-sided and constricting.6,8 Furthermore, South African consumers eat foods that reach them through food system circuits that criss-cross the country, with food retailers often selling food imported from other continents.
By contrast, the conceptual thinking embedded in the 2013 Policy embraces a more comprehensive approach to overcoming hunger and malnutrition.2 Whilst the 2013 Policy underscores the need to produce and enable access to enough healthy food, it also prioritises food preparation; what people actually consume, the nutritional health outcomes of the right diets, and the roles of social protection also receive attention.6,9 Concerned with how to realise the food rights of people living in South Africa, the 2013 Policy reiterates the government's obligations in achieving this constitutional right. State-financed social protection, which includes meal provision at public schools and other food delivery centres, has a vital role to play in this regard.10 Moreover, fiscal assistance to realise food and nutrition rights cannot overlook any segment of food value chains, such as crop and livestock farming, agro-processing in food manufacturing, local and global food trade or consumption, coupled with nutritional benefits for consumers.
The 2013 Policy was jointly tabled by the Departments of Social Development and Agriculture, Land Reform and Rural Development - two departments with core mandates that usually concentrate on opposite extremes of food value chains. The Department of Agriculture, Land Reform and Rural Development oversees the full farming cycle that includes marketing and trade of farm outputs, whereas the Department of Social Development delivers social safety nets, such as suites of cash grants and food parcels or vouchers. Regular and multilevel sub-national interactions among government departments involved in different food sector activities signal the possibility for a convergence towards a unifying approach to food and nutrition security, with the potential to eliminate the inefficiencies of fragmented operations among stakeholders who ought to cooperate.5 Indeed, interdepartmental collaboration at the policy design level began to pave the way for institutionalised cooperation among state actors in implementing the 2013 Policy.2,10 Information gathered from key informant interviews with relevant government officials, non-state organisations and multilateral donors highlighted that decision-makers and implementers also started identifying the 2013 Policy financing needs and how to pay for them from state and non-state sources.
Aliber and Hall11 assembled South African public spending information on 'food availability' that sheds light on how much the state invests in crop and livestock farming. The Aliber-Hall study updates and extends a previous publication in an edited volume that examined fiscal investments in southern Africa in accordance with the 2003 Maputo Declaration on agricultural assistance.12 Although this collection of studies documented the amount and categories of fiscal allocations for food output (or bolstering the capacity to produce enough staple foods), almost all countries fell short of meeting their 2003 commitments.13,14 These studies prioritise budgetary support for household subsistence and smallholder farmers, and are restricted to the production dimension of food and nutrition security. In 2013, South Africa's National Treasury commissioned a Performance and Expenditure Review aimed at assessing the 'value for money' from state spending on nutrition and food security for children under 5 years. Despite the technical mapping of spending along an input-activity-outcome cycle of project programming, substantively, the review did not go beyond costing nutrition interventions15 from a health outcome view for a vulnerable sub-population.
This article contributes to research on feasible practices for delivering better food and nutrition outcomes for all people in South Africa. We argue that pro-poor solutions to hunger and greater responsiveness of policy to local realities must start from a holistic food value chain viewpoint. Since the nascent conceptualisation of this new policy, food policy stakeholders have acknowledged that getting implementation right hinges on securing enough funding to operationalise the 2013 Policy. In 2017, the efforts to translate the 2013 Policy into a funded implementation plan culminated in forecasted costs over an initial cycle for 2018-2023.10 The government contracted DNA Economics, a private consultancy, to estimate the likely costs of the NFNSP for the first 5-year cycle. At that time, total implementation costs of the 2013 Policy for the 5-year period amounted to ZAR86.6 billion, but this costing exercise did not address tough questions on from where the money would be sourced.
The research questions addressed by this study are: If the state is the source of funding, then how will this be divided between national and subnational spheres of government? What are the implications for information systems and mechanisms to monitor and detect a shortfall or surplus in spending on food and nutrition activities to proactively mitigate funding gaps? What do learnings about funding to realise the aspirations of the 2013 Policy for the 2018/2019-2022/2023 period mean for costing and spending in future?
Financing food and nutrition assistance: Purposive global synthesis
This section situates South Africa's policy-induced investments in food and nutrition assistance in a larger global context. An overarching question guiding this rapid and selective synthesis is: what insights can be harvested and distilled from global studies on financing food and nutrition policy for impactful rollout? Any systematic comparison of South Africa's food and nutrition policy financing patterns with worldwide experience will require the same criteria and measures as a reference point. Using a standardised and uniform yardstick is sensible but also foundational in testing the usefulness of comparative methods. Without such a yardstick, similarities and differences detected between South African data and that for comparable countries are highly likely to lack consistent and reliable explanations. Globally, explanatory inconsistencies across countries arise from the absence of a coherent database with indicators on funding for food and nutrition that will pass basic methodological criteria and tests at present.9,16,17
Even though an appropriate cross-country data set does not exist, studies to close this gap have progressed along exploratory tracks, with crucial lessons for South Africa. Conceptually, methodologically and technically, extant investigations differ in terms of the analytical principles that underpin them. These studies exploit purposeful and discretionary techniques that balance the need for funds with the potential or available funding sources. As a minimum, a comparative analysis demands ingredients such as reliable and up-to-date data on funding with meaningful and compatible variables measured in the same way for a large enough number of countries. Despite these gaps, ad hoc measurements of financing needs and resources continue to evolve. Analysts have opted for different definitions of what is being monitored and measured, and then customise the empirical methods in line with the content and scope of variables and underlying information.7, 9,16,18
The financing of food and nutrition policies straddles multiple categories, such as the direct costs of nutritious food, the costs of administrative governance and grassroots delivery, and an integrated data management system that is fit for purpose.17 While the monetary value of providing consumable items is a major and dominant element of food aid and anti-hunger interventions, it has been acknowledged as but one category of financing food and nutrition assistance.18 Lentz and Barret16 show that food and nutrition policy goals, coupled with the food needs of the vulnerable when hunger emergencies break out, drive the demand for public investment in food and nutrition safety nets. In addition to insights drawn from these case studies, a quick overview of how India and Ghana have dealt with similar food and nutrition funding questions is particularly instructive.
In Rajasthan state, India, Ghai et al.19 examined funding requirements for adequate nutrition against available resources. This was done by conducting a gap analysis through comparing the costs of core nutrition programmes in Rajasthan with funding available for nutrition-specific programmes from state plans and budgets. The analysis found a 69% funding gap in the financial resources needed for fully scaling up the 13 fundamental nutrition interventions in 2016-2017. In addition, Ghai et al.19 established that government financing of nutrition interventions had been steadily declining, with a 3% reduction from 2014-2015 to 2016-2017. This resulted in the funding gap growing to 69% in 20162017, from 66% in 2014-2015.
Pomeroy-Stevens et al.20 assessed how nutrition is prioritised and funded in Uganda through the Uganda Nutrition Action Plan (UNAP) between the 2013-2014 and 2014-2015 fiscal years. They pointed out that data on expenditure are not always there for all funding means. As a result of gaps in data, it was not possible to identify and compare funding between projects in the government's budget and non-state actors. Pomeroy-Stevens et al.20 also found that funding allocations for the UNAP seemed to be more than adequate for the projected costs for 2014 to 2015 as they were about 10 times the planned cost for the year. However, they observed that funding allocations did not always align with the priority for the respective objective in the costing exercise. A comparison of funding allocations with the cost requirements of the five UNAP objectives showed some discrepancies in relative proportions.
Coile et al.21 studied the national multisectoral nutrition plans of 26 countries to assess their effectiveness when planning and implementing nutrition interventions. Alongside how to implement and manage the multisectoral nutrition plan in sampled countries, the review also zoomed in on financial issues such as budgets and costs for the years 2014 through 2020.21 They found that significant gaps were common across the reviewed plans, including not properly designating each nutrition action among responsible agencies, inadequate consideration and planning for risks in the implementation plan and required mitigation strategies, lack of specific mechanisms to organise and manage research, and lack of financial gap assessments and specified procedures to track allocation of financial and other resources. Of the 26 multisectoral nutrition plans assessed by Coile et al.21, only 7 estimated the funding gaps for the costed interventions, 6 described the criteria for allocating resources, and 4 included the mechanism for financial tracking, including allocations and expenditures as well as state and non-state funding.
One standout learning from this quick and purposeful synthesis is that low- and middle-income countries wrestling with high levels of food and nutrition insecurity often lack the fiscal space to provide food assistance to hungry populations.7,14 Poor countries that experience protracted food deficits coupled with tight fiscal constraints usually depend on external aid to meet their food and nutrition needs. Direct food assistance is one form of this external aid delivered by agencies such as the World Food Programme and private donors mainly based in Europe and North America. Food aid can also be in the form off financial donations, in which case the transferred money is conditional on its exclusive use to buy and distribute food. External development assistance, whether in the form of ringfenced money or not, is a prominent source to help realise the Sustainable Development Goals.18 Yet upper-middle-income countries like South Africa may not always qualify for multilateral or private financial donations, which are increasingly scarce and stringently allocated on the basis of narrow economic criteria. Developing countries in this group, however, also battle to stretch constrained public budgets across competing human well-being priorities in the context of growing public debt burdens, fiscal deficits, macroeconomic crises and sociopolitical conflicts that further undermine their limited capacity to fund all components of food and nutrition assistance.7
Guidance from emergent international evidence suggests that South Africa's purposeful approach to food and nutrition financing aligns with current trends and practices. While authorities identify sources to adequately fund the implementation of policies and plans, it is also crucial to document experiences and build data platforms for the holistic monitoring and improvement of the food and nutrition situation in the country.
Funding data extraction, assembly and analysis methods
Estimating the gap in funds for the implementation of food and nutrition activities tied to the 2013 policy is a complex task because the data are scattered across hard-to-access systems of distinct government departments. Departmental and provincial expenditure estimates published by National Treasury are a traditional source of information about public funding for food and nutrition security. This source broadly classifies funding items for departmental sub-programmes but reports highly aggregated fiscal allocations. These departmental expenditures do not show spending on activities that can be linked across different state and non-state funding sources. Even though such aggregated fiscal spending information is publicly accessible, reported figures do not align with the costs per strategic objective of the NFNSP To overcome the limitations of data in the public domain, we extracted spending on food and nutrition activities from administrative registers that state and non-state stakeholders maintain. Categories to organise the data ranged from direct production and consumption assistance to administrative operations and food system metrics that match the NFNSP's strategic objectives.
Gaps in funding the NFNSP refer to shortfalls or surpluses in available funds relative to the projected implementation costs of food and nutrition activities. Framing this in elementary accounting terminology means that a funding gap is the difference between forecasted costs and allocated or spent funds. This study uses the high-level implementation cost framework of the NFNSP and projected monetary values for 20182023, but does not recalculate the 2017 financing targets. To construct the implementation costing framework, government officials and DNA Economics consultants started from the 2013 food and nutrition policy, translating it into specific outcomes, deliverables and activities. In the context of the framework, they then determined the operational costs tied to activities for the specific deliverables mentioned above.10
Data on funds actually spent on food and nutrition activities were gathered from expenditure databases of state and non-state stakeholders. Additional information was gathered through key informant interviews with relevant officials from government, multilateral donors and non-state organisations. It is important to highlight that the interviews, conducted in line with the Human Sciences Research Council ethical standards and clearance requirements, were instrumental in overcoming the problem of accessing the data mentioned above as well as understanding the data collected.
The cost of the implementation plan was done at different levels of aggregation, layered in a base-to-apex pyramid. The overarching cost of the plan at the apex can be traced to lower levels that display more detailed costing information. Base-level cost estimates show the highest level of detail and disaggregation. It comprises micro-level costs to engage in activities (like food and nutrition awareness campaigns) and deliver outputs (such as meals served to school children, smallholder farmers' production assistance, data sets). The most meaningful mid-level aggregation is costing for each Strategic Objective defined in the original plan.
Planned implementation costs, estimated for disaggregated variables, do not perfectly match the expenditures of stakeholders on 2013 Policy priorities. The main reason behind this mismatch is the non-existence of a decentralised spending monitoring tool with indicators that correspond with the costing dimensions captured in the 2017 Plan. If a proper spending monitoring tool had existed, it would have helped to document the flow of funds in real time. Over the middle range of aggregation, however, expenditure categories are well defined and correspond with 'variables' in the 2017 costed plan, as detailed in the next section.
Past expenditure is a useful benchmark for the funds that stakeholders are likely to have available in future, assuming that everything else remains constant. We exploit the benefits of historical spending data, processed and audited spending.
Information on the funds that stakeholders have committed in support of food and nutrition security is not stored in one centralised data repository but kept in reporting systems of multiple agencies. In our study, we accessed and combined documented expenditures from diverse stakeholders.
A funding gap [FG] is simply the difference (shortfall) between a desired or planned spending target and actual expenditure. In this study, the goal was to estimate the FG for each National Food and Nutrition Security (NFNS) Plan Strategic Objective (SO) as well as the sum total for all SOs. A simplified way to express the aggregate funding gap (FGAT) is:

• where YT is the DNA Economics' target expenditure in ZAR for all years (subscript T = 5, or (τ1,..., τ5)), with τ denoting a year and T the sum of consecutive years;
• where XT is the actual state and non-state expenditure in ZAR for all years (subscript T = 5);
• where superscript A denotes the aggregate figure for all SOs (A = α1,..., α7 = ∀α).
Given the value of YT, then as τ → T, FGAT depends on the value of XT. However, the aggregate value of XT is as important as its composition ντ, made up of diverse state and non-state sources, which can be defined as:

• where ...S includes all expenditures of the state sector for τ1,...,τ5 or ∀τ
• where includes all expenditures of the non-state sector for ∀τ
Following the aggregate expenditure relations outlined above, the funding gap per strategic objective (superscript: α1,..., α7 or ∀a) can simply be written as:

• where … α1 denotes SO#1, and so forth ∀ α .
2017 funding needs: DNA costing estimates
When DNA Economics initially costed the NFNSP they looked at the cost drivers and offered best "guestimates" on quantifiable benefits, such as support for smallholder food production and delivering nutritious food to school children. In addition to the direct nutritional and health benefits, they also attempted to quantify cost savings due to the reduced prevalence of lifestyle diseases that flow from nutritious and healthier diets.
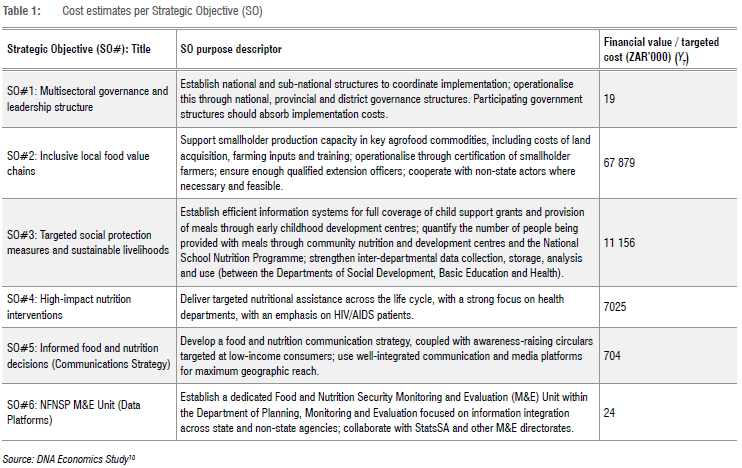
The DNA model fits costing parameters for the inputs, activities, outputs and outcomes tied to each strategic objective. To populate the DNA costing model with relevant monetary data, the research team conducted in-depth interviews and workshops with officials who implement and manage the food and nutrition mandates of government departments and non-state stakeholders.10 The framework defined priorities to implement the NFNSP and then estimated what it would cost to execute these activities, including assumptions and forecasted costs, by calculating the cost to host a meeting to coordinate the Plan (SO#1) or distribute nutrition supplements and food to women and babies through local clinics (SO#4), as summarised in Table 1.
Table 1 sums up that, in 2017, DNA Economics and Cornerstone estimated that the overall costs of implementing the Plan ( YT) amounted to ZAR86.8 billion over the 5-year period from 2018/2019 to 2022/2023. However, not all the SOs contribute equally to the Plan's overall costs. For example, SO#2 (ZAR68.8 bn), SO#3 (ZAR11.1 bn) and SO#4 (ZAR7 bn) account for 99.16% of the total costs, whilst the other three objectives contribute just 0.84%.
The reasons for the costs per strategic objectives being so uneven differ but predominantly arise from the higher priority given to direct farm-to-fork food value chain assistance and coordination.10 As is evident from the descriptors in Table 1, summarised from the implementation costing framework, it costs more to deliver on these priorities. Projections based on historical spending patterns on farmland access, assistance to smallholder crop and livestock farmers, school feeding schemes and food distributed by nutrition programmes, underscore the need for a higher weight on these costs. Direct food and nutrition provision, the core purpose of the NFNSP, is understandably more expensive (or allocated the bulk of available resources) than collecting data and maintaining food and nutrition databases coupled with coordinating multiple operations in practice.
Funding gaps: systematic calculations
2018/2019-2021/2022 fiscal spending
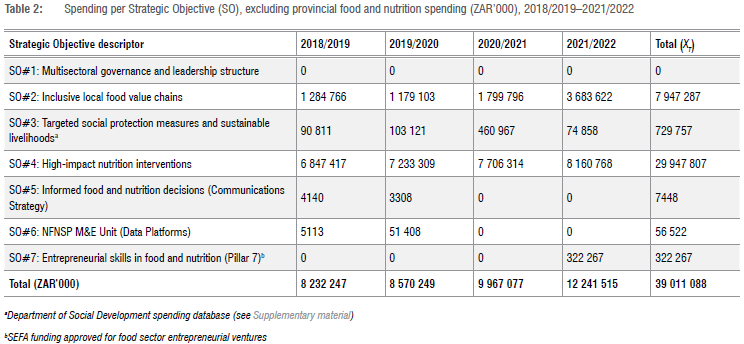
The administrative database on public spending secured from National Treasury allows for estimates that are closer to the NFNSP's SOs because the database stipulates the primary objective of itemised expenditures. Strengths of this data set include the separation of programme management spending from public funding to support the food system in the provinces and at a national level.
In Table 2, there is no information on spending by the Department of Planning, Monitoring and Evaluation, the Office of the Deputy President, and the Offices of Premiers towards the establishment of food and nutrition security councils. The NFNSP estimated a cost of ZAR18.76 million over the period 2018/2019 to 2021/2022 towards the establishment of the multisectoral food and nutrition security councils. This is probably due to the lack of a reporting template to document the spending of stakeholder departments in the Plan's administration costs.
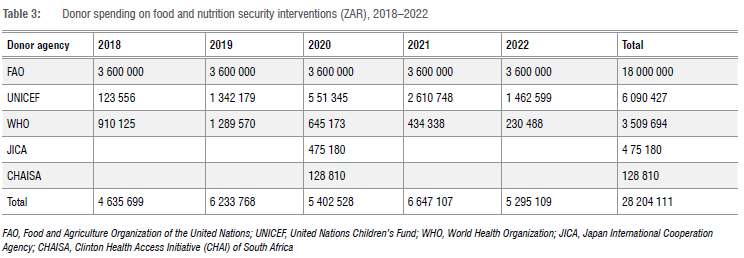
The Department of Agriculture, Land Reform and Rural Development is the department in charge of everything under SO#2. With this emphasis on agrofood value chain development, this department committed 60% of the Comprehensive Agricultural Support Programme grant to the promotion of smallholder value chain participation through accessing more profitable agrofood markets.2 Closer scrutiny of the Department of Agriculture, Land Reform and Rural Development's strategic documents and annual reports indicated that Japan International Cooperation Agency supported aspects of SO#2, reflected in the non-state funding sources in Table 3.
The Departments of Health, Home Affairs, Basic Education and Social Development drive SO#3. The figure reported in Table 2 falls short of the cost estimated by DNA Economics for the 5-year period from 2018/2019 to 2022/2023. Improved access to high-impact nutrition for vulnerable groups makes up the bulk of costing for SO#4.
The Department of Planning, Monitoring and Evaluation has developed an advocacy and communication strategy with the assistance of the United Nations Children's Fund (UNICEf), but this advocacy and communication strategy has not been implemented significantly. Available information shows that the only funding towards this SO#5 subtheme is from UNICEF, totalling ZAR6.07 million over the period 2018/2019 to 2021/2022. Therefore, the funding gap for this strategic objective is equal to ZAR619.53 million. The Department of Basic Education spends a proportion of the National School Nutrition Programme (NSNP) Grant towards nutrition education (including deworming and hygiene practices) in schools. Specifically, according to the NSNP Grant framework, the Department was allowed to spend a maximum of 0.5 per cent in 2018, 0.4 per cent in 2019 and 2020 and 0.2 per cent in 2021 and 2022.
Nevertheless, nutrition education in early childhood development centres has not yet been implemented as the process of migration of the responsibility for early childhood development centres from the Department of Social Development to the Department of Basic Education is still underway. Other nutrition education programmes that aim to create awareness about the importance of healthy eating and obesity among consumers include the National Nutrition Week and the National Obesity Week, coordinated by the Department of Basic Education, Department of Health and Department of Social Development, in collaboration with other players, namely Nestlé, Milk Producers' Organisation (MPO) and Consumer Education Project (CEP) of Milk South Africa. However, the costs of these campaigns are not available.
SO#6 entails, among other tasks, harvesting food and nutrition security indicators from national surveys (such as the General Household Survey), including a customised Food and Nutrition Security survey. An amount of ZAR45 million from the llima/Letsema Programme was transferred to the Human Sciences Research Council to conduct the National Food and Nutrition Security Baseline Assessment for the food and nutrition security survey of South Africa's Vulnerability Assessment Committee.
Earlier iterations of the NFNSP were confined to six strategic objectives without any explicit provision for entrepreneurship across agrofood value chains. Real and/or potential contributions of small-scale entrepreneurial activities under the auspices of the Department of Small Business Development were thus excluded from the 2018-2023 costing of the national plan. The introduction of Pillar 7 (S0#7) elevates the role of entrepreneurship through connecting the implementation and delivery of the NFNSP with the Small, Medium or Micro Enterprise Support Plan. Relative to the scope of funding needs, enterprise loans and subsidies cover a small amount to purchase some fixed assets (like infrastructure and machinery) as well as pay for operational activities.
With this snapshot of spending history extracted from administrative databases, exploratory interviews also probed the adequacy of funds relative to what is needed, expenditure in the pipeline and the certainty of access to available sources of finance beyond 2023. Interviews proved invaluable to interpret past spending patterns and think through the prospects for financing the Plan in the period ahead.
Interviewees from government departments also confirmed receiving support from multilateral donors and non-state organisations. Donor support consists of a mix of administrative assistance, distribution of food and nutrition supplements to vulnerable populations, the promotion of healthy eating, and dissemination of statistical information about food and nutrition.
While donors use different technical categories of their support, their accountability and reporting systems require that they document the monetary value of all donations. Categorising these investments in terms of the Plan shows that donors render assistance in SO#4 (high-impact nutrition interventions), SO#5 (informed food and nutrition decisions across the life cycle) and SO#6 (data management and monitoring and evaluation). Table 3 shows that the total contributions from non-state funding sources amounted to ZAR28.2 million, which is relatively small in relation to financing needs and resources for all the Strategic Objectives in the Plan.
2018/2019-2021/2022 subnational spending
The NFNS Policy and Plan recognise the necessity for subnational coordination and implementation of food security programmes because hunger is unevenly distributed across different localities. Targeted food and nutrition assistance usually combines food poverty status with its prevalence in a province, municipality or town. Localities with higher numbers of hungry people should also receive a higher proportion of food assistance funding, especially funding allocated to national and provincial government budgets.
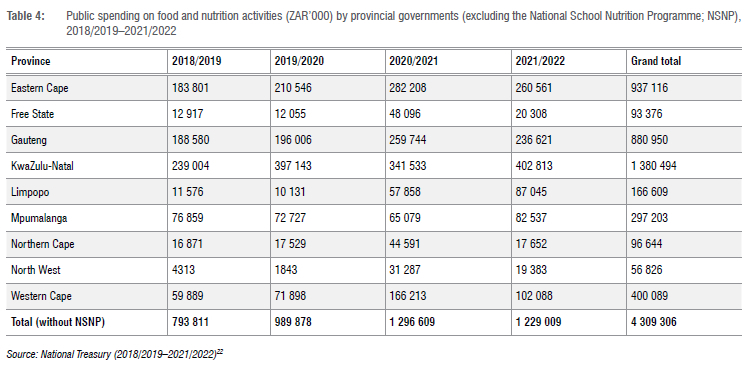
Table 4 summarises the public funding given to provinces to finance their food and nutrition activities. Provinces received ZAR35.2 billion for food and nutrition activities from 2018/2019 to 2021/2022. Figures include transfers based on government's equitable share formula and conditional grant transfers for the delivery of services such as food assistance to vulnerable populations. The NSNP is an example of such transfers and makes up 88% (±ZAR30.9 billion) of the total spending for this period.
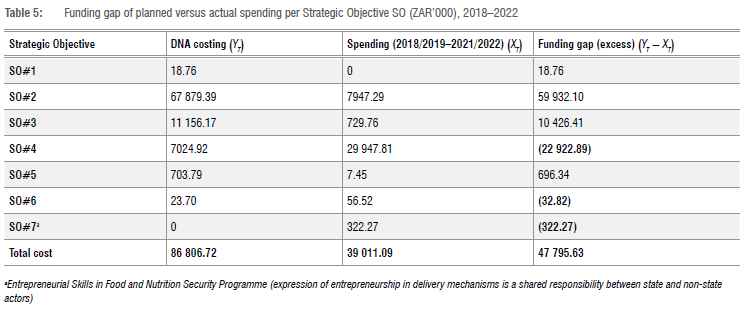
Clearly, subnational government spending on food and nutrition activities cannot be excluded from resources available to cover the 2017 cost estimates. In light of the foregoing discussion on fiscal transfers to provinces, caution must be exercised when determining the funds available to implement the NFNSP It is important to avoid double counting and apply the rules of equitable shares and conditional grant transfers, especially the NSNP Table 5 summarises the overall funding gap and the gap for each Strategic Objective, following the gap Equations 1 and 2. Itemised expenditures in National Treasury's database (which is not in the public domain) make it possible to trace food activity spending and connect it to spending activities for each Strategic Objective. Careful analysis and piecing together expenditure on food and nutrition items reveal that the state has actually spent ZAR39 billion on flan-related priorities since 2017. Compared to the 2017 cost target, this leaves a funding gap of ZAR47.6 billion. This includes provincial spending distributed through equitable share and conditional grant transfers to provinces.
Funds that subnational state structures and non-governmental agencies have spent do not form part of Table 5. Provincial spending on food and nutrition security activities not counted in equitable share or conditional transfers (to avoid counting the same amount in both national and provincial expenditures) amounted to ZAR4.3 billion as reported in Table 4. Expenditures of provinces marginally cut the funding gap (FGAT = YT - XT) = ZAR43.3 bn, which means that, since 2018, about 50% of the needed resources was secured.
Given the initial costing forecasts of DNA Economics, strategic objectives incorporate activities that involve cooperation and spending from different stakeholders. The layered presentation of actual expenditures on food and nutrition activities highlights the uneven contributions to the funding needs of the NFNSP as well as uneven funding gaps per Strategic Objective. Consider the zero expenditures recorded for the functionality of the national and sub-national coordinator structures (known as SO#1). The resulting deficit, ZAR18.76 million, did not stifle the operations of these structures because participating stakeholders evidently absorbed these costs. It was not possible to verify or corroborate actual expenditure on this vital administrative function, pointing to gaps and limitations in cost and expenditure monitoring systems that may also account for deficits (or surpluses) in other Strategic Objectives.
Starting from 2017, the estimated costs for an initial 5-year cycle (20182023) of the NFNSP ( Υτ) amounted to ZAR86.8 billion. Whilst resources exist in the state and non-state sectors to cover the financial needs of the NFNSP for the period 2018-2023, authorities only met 50% of the Plan's funding needs. Options to cover the shortfall (FGAT ) of ZAR43.3 bn require that coordinators of the NFNSP rethink its conceptual design and how to finance its effective and efficient execution.
The size of the FGAT for this initial costing cycle means the assumption among decision-makers that enough public funding should be available to cover the forecasted spending lacks reliable evidence. Insights from selected case studies and a systematic funding gap analysis to track funding flows have revealed that funding South Africa's food and nutrition policy interventions almost exclusively relies on national and provincial budgets. Expenditures of multilateral donors and other non-state agencies account for less than 5% of the NFNSP spending targets, restricted to costs of administration and awareness campaigns.
The use of our systematic framework and method to estimate the overall funding gap presupposes that forecasted costs exist. Furthermore, this approach also caters for calculating funding surpluses and deficits for each Strategic Objective which captures the envisaged ways of streamlining the operations of food and nutrition support in practice. An exclusive focus on the overall funding needs of the NFNSP should avoid inferences that a deficit Strategic Objective can be balanced against one with a surplus - a plausible interpretation given the aggregation method hardwired into the 2017 implementation cost estimates. In practice, however, funding gaps per Strategic Objective cannot be written off against each other, even though the Strategic Objectives positively complement each other in terms of substance and scope. For example, direct nutrition assistance (especially through the school nutrition scheme) in SO#4 overlaps with publicity campaigns for better food and nutrition knowledge in SO#5. However, covering the deficit of SO#5 (FGTa5) of ZAR696.3 m with the surplus of SO#4 (FGTa4) ZAR22.9 bn is not feasible without the approval and willingness-to-pay by contributing stakeholders. Similarly, loans and subsidies ringfenced for smallholder farmers through SO#7 will require institutional agreements to draw on this surplus to cover the SO#2 deficit for food value chain funding needs.
Conclusion
We sought to determine the available funding sources to implement the Strategic Objectives of South Africa's NFNSP by building a unique data set based on historical spending information for the 2018-2022 funding cycle. We used an elementary funding gap equation for a systematic calculation of the funds needed for NFNSP. We assembled fragmented food spending information and explored how state and non-state sources can be tapped to meet these funding needs. Our intuitive estimation framework concisely relates forecasted costs with actual expenditures, enabling a step-by-step calculation of funds that state and non-state agencies spend on food and nutrition activities. Similar to the ad hoc and tailored approaches to financing food and nutrition policies internationally, this purposeful approach can be improved through ongoing application and testing. Using this approach to probe historical data, assembled from the administrative databases of National Treasury, different government departments with mandates to provide food and nutrition assistance and the donor community, has proven helpful to identify sources to finance the NFNSP in future planning cycles.
While the aspiration of adequate food and nutrition for all, entrenched in the 2013 policy and operationalised in the 2017 plan, is laudable, it is increasingly hard to achieve without a proactive approach to resourcing the NFNSP Mobilising enough resources to finance all Strategic Objectives over the first 5 years of implementing the NFNSP remained an afterthought, yet it should have been resolved at the time of the initial costing estimates. Subsequent cycles of costing and funding systematic food and nutrition security interventions can be streamlined with a quarterly implementation cost monitoring system across national and sub-national coordination structures. Coordination meetings of food and nutrition authorities need to adopt and regularly update a clear outcomes-driven plan and monitoring template in which the use of secured funds is documented. In future, it will be crucial to institutionalise the coordination of Strategic Objectives in the mandates of different government departments responsible for the NFNSP that allow it to periodically revisit and improve the translation of the NFNS Policy into the National Plan to better inform future funding needs and resourcing decisions. Without a comprehensive food value chain perspective of fiscal support for food and nutrition policy, its funding imperatives will continue to elude the South African government.
Acknowledgements
Officials in government departments and the Food and Agriculture Organization (FAO) of the United Nations in South Africa supported access to unique administrative data not in the public domain. We acknowledge the expertise of the Human Sciences Research Council subject librarian, Ms Shingi Muzondo, who assisted with finding appropriate literature at short notice. We appreciate the guidance received from the anonymous editor and reviewers to improve the narrative. We acknowledge these contributions but remain solely responsible for the analysis, conclusions and any remaining errors.
Data availability
The data are not available. We obtained primary data from National Treasury with their permission to use it for our research but not to share input records with third parties.
Declarations
We have no competing interests to declare. We have no AI or LLM use to declare. Ethical clearance was provided by the Human Sciences Research Council's Research Ethics Committee (protocol no. REC 10/24/11/21).
Authors' contributions
PT.J.: Conceptualisation, methodology, investigation, sample analysis, formal analysis, validation, data curation, writing - the original draft, writing - review and editing. V.M.: Conceptualisation, methodology, investigation, sample analysis, formal analysis, validation, data curation, writing - the original draft, writing - review and editing. S.M.: Conceptualisation, methodology, investigation, sample analysis, formal analysis, validation, data curation, writing - the original draft, writing -review and editing. All authors read and approved the final manuscript.
References
1. Government of South Africa. The national policy on food and nutrition security for the Republic of South Africa. Government Gazette,No. 37915, 22 August 2014. Pretoria: Government of South Africa; 2014. [ Links ]
2. Parliamentary Monitoring Group (PMG). National food and nutrition security implementation plan. Committee Meeting Proceedings [webpage on the Internet]. 2017 November 14 [cited 2018 Nov 08]. Available from: https://pmg.org.za/committee-meeting/25488/ [ Links ]
3. Pereira L, Drimie S. Governance arrangements for the future food system: Addressing complexity in South Africa. Environ Sci Policy Sustain Dev. 2016;58(4):18-31. https://doi.org/10.1080/00139157.2016.1186438 [ Links ]
4. Hendriks S. Food security in South Africa: Status quo and policy imperatives. Agrekon. 2014;53(2):1-24. https://doi.org/10.1080/03031853.2014.915468 [ Links ]
5. Termeer C, Drimie S, Ingram J, Pereira L, Whittingham MJ. A diagnostic framework for food system governance arrangements: The case of South Africa. NJAS - Wageningen J Life Sci. 2018;84:85-93. https://doi.org/10.1016/j.njas.2017.08.001 [ Links ]
6. Jacobs P, Nyamwanza A. Stronger policy coordination for better food and nutrition security outcomes. Pretoria: HSRC; 2020. https://repository.hsrc.ac.za/handle/20.500.11910/15229 [ Links ]
7. FAO, IFAD, UNICEF, WFP WHO. The state of food security and nutrition in the world 2024: Financing to end hunger, food insecurity and malnutrition in all its forms. Rome: FAO; 2024. https://doi.org/10.4060/cd1254en [ Links ]
8. Drimie S, Ruysenaar S. The integrated food security strategy of South Africa: An institutional analysis. Agrekon. 2010;49(3):316-37. https://doi.org/10.1080/03031853.2010.503377 [ Links ]
9. Marivoet W, Becquey E, Van Campenhout B. How well does the food consumption score capture diet quantity, quality and adequacy across regions in the Democratic Republic of the Congo (DRC)? Food Sec. 2019;11:1029-1049. https://doi.org/10.1007/s12571-019-00958-3 [ Links ]
10. DNA Economics. NFNS plan costing chapter (Report Commissioned by the Department of Planning, Monitoring and Evaluation). Pretoria: DNA Economics; 2017. [ Links ]
11. Aliber M, Hall R. Support to smallholder farmers in South Africa: Challenges of scale and strategy. In: Jacobs P, editor. Equitable rural socioeconomic change: Land, climate dynamics, and technological innovation. Cape Town: HSRC Press; 2019. p. 45-60. [ Links ]
12. Aliber M, Hall R. The case for re-strategising spending priorities to support small-scale farmers in South Africa. In: Nyagah L, editor. Seeds of growth: Financing smallholder farming in southern Africa. Cape Town: Institute for Democracy in South Africa; 2011. p. 67-82. [ Links ]
13. Nyagah L, editor. Seeds for growth: Financing smallholder farming in southern Africa. Cape Town: Institute for Democracy in South Africa (IDASA); 2011. [ Links ]
14. African Development Bank (AfDB). Feed Africa: Strategy for agricultural transformation in Africa 2016-2025 [document on the Internet]. c2016 [cited 2024 Aug 14]. Available from: https://www.afdb.org/fileadmin/uploads/afdb/Documents/Generic-Documents/Feed_Africa-_Strategy_for_Agricultural_Transformation_in_Africa_2016-2025.pdf [ Links ]
15. National Treasury of South Africa. Nutrition and food security for children under five years old: 2015 - Performance and expenditure review (PER), health sector. Commissioned Research Report (Cornerstone Economic Research and consultants). Pretoria: National Treasury; 2015. [ Links ]
16. Lentz EC, Barrett CB. The economics and nutritional impacts of food assistance policies and programs. Food Policy. 2013;42:151-163. https://doi.org/10.1016/j.foodpol.2013.06.011 [ Links ]
17. United Nations (UN). Financing United Nations catalytic action to 'rescue' the Sustainable Development Goals: 2021 annual report. Joint SDG Fund [webpage on the Internet]. c2021 [cited 2023 May 21]. Available from: https://annualreport.jointsdgfund.org/2021-financing-united-nations-catalytic-action-to-rescue-the-sustainable-development-goals/ [ Links ]
18. Swinnen J, Kosec K. The road to resilience: Rethinking responses to food crises. In: International Food Policy Research Institute 2023 global food policy report: Rethinking food crisis responses. Washington, DC: International Food Policy Research Institute; 2023. https://doi.org/10.2499/9780896294417 [ Links ]
19. Ghai K, Rana Y, Ahmad N, Clift J. Nutrition financing in Rajasthan: Trends and gaps in 2016-17. Rajasthan: Results for Development Institute (R4D); 2016. Available from: https://r4d.org/wp-content/uploads/Rajasthan-Nutrition-Financing-Policy-Brief-2016-17.pdf [ Links ]
20. Pomeroy-Stevens A, D'Agostino A, Adero N, et al. Prioritizing and funding the Uganda nutrition action plan. Food Nutr Bull. 2016;37(4_suppl):S124-S141. https://doi.org/10.1177/0379572116674554 [ Links ]
21. Coile A, Wun J, Kothari MT, Hemminger C, Fracassi P, Di Dio D. Scaling up nutrition through multisectoral planning: An exploratory review of 26 national nutrition plans. Matern Child Nutr. 2021;17(4):1-13. https://doi.org/10.1111/mcn.13225 [ Links ]
22. National Treasury of South Africa. National and provincial food and nutrition expenditure (electronic public spending, audited); 2018/19-2021/22. Pretoria: National Treasury; 2023. [ Links ]
 Correspondence:
Peter Jacobs
Email: pjacobs@hsrc.ac.za
Received: 04 Nov. 2024
Revised: 09 June 2025
Accepted: 12 June 2025
Published: 11 Aug. 2025
Editors: Annchen Mielmann, Leslie Swartz
Funding: None
Supplementary Data
The supplementary data is available in pdf: [Supplementary data]
