



Services on Demand
Journal

Article
 English (pdf)
 Article in xml format
 Article references
 Automatic translation
 Send this article by e-mail
Indicators
Related links
-
 Cited by Google
 -
 Similars in Google
Share

 Permalink
South African Journal of Science
On-line version ISSN 1996-7489Print version ISSN 0038-2353
S. Afr. j. sci. vol.122 n.1-2 Pretoria Jan./Feb. 2026
https://doi.org/10.17159/sajs.2026/23146
RESEARCH ARTICLE
The adoption of Vehicle-to-Anything (V2X) in South Africa will reduce the combined cost of embedded solar generation and driving
David R. Walwyn
Graduate School of Technology Management, University of Pretoria, Pretoria, South Africa
ABSTRACT
Battery electric vehicles (BEVs) are essential to global decarbonisation roadmaps and are being increasingly adopted in many countries. However, significant techno-economic barriers remain before the adoption of BEVs becomes widespread in the Global South. Issues include higher costs, grid instability due to high electricity demand during peak periods, lack of recharging infrastructure and restrictive driving ranges relative to internal combustion engines. Vehicle-2-Grid (V2G) can play a critical part in load balancing (peak shaving) and reducing costs for BEV owners. In this study, the potential of V2G was explored in more detail, looking at the development of appropriate hardware and software for V2G, the techno-economic assessment of V2G from a user and system perspective, and policy measures to support uptake of electric vehicles. The study shows that households with V2G-enabled BEVs achieve cost parity with households with internal combustion engine vehicles. Systems which connect BEVs to V2G, and supportive V2G metering and tariff policies, would accelerate BEV adoption in emerging markets.
SIGNIFICANCE:
• Small-scale embedded solar (SSES) is an expensive option for homeowners; the levelised cost of energy is double the cost of power from Eskom.
• V2G is an attractive option for SSES owners if the vehicle is charged from SSES during the day.
• The calculated annual worth of a BEV with SSES is equivalent to the base case of a fossil-fuel-based vehicle and grid-based energy.
• Using an optimal charging strategy, BEVs can reduce grid-based electricity demand and travel costs.
• Bidirectional metering, V2G and time-of-use tariffs will be essential for the migration to BEVs.
Keywords: vehicle to grid, grid interconnection, battery electric vehicle, annualised cost
Introduction
Battery electric vehicles (BEVs) are an essential component of global initiatives to decarbonise systems of mobility.1-3 By the end of 2023, there were already 40 million electric vehicles on the road and the number is predicted to grow to 250 million by 2030.4 Sales of electric vehicles have grown exponentially, reaching nearly 15 million in 2023, with about 60% of the sales attributed to China.5
However, there are considerable techno-economic and technological barriers yet to be overcome before the adoption of BEVs becomes widespread in many countries.6,7 Issues include the high initial BEV cost, grid instability due to high electricity demand during peak periods, lack of recharging infrastructure, high battery costs and limited lifetimes, restrictive driving range, long recharging times and high levelised cost of driving (LCOd) or total cost of ownership relative to internal combustion engines.8-10
One solution to these issues, already widely explored and reported in the literature, is the adoption of Vehicle-to-Grid (V2G) technology11, or more broadly Vehicle-to-Anything (V2X), where X includes multiple sources of demand such as residential or commercial properties, mobile homes and off-grid machinery. Examples of new applications include Vehicle-to-Building (V2B), Vehicle-to-Load (V2L), Vehicle-to-Home (V2H) and Vehicle-to-Infrastructure (V2I).12
V2G is the integration of BEVs within an electricity grid in a way that allows vehicle owners to sell energy from the BEV batteries to utility companies. Given that, for much of the day, passenger vehicles are not being used13 and that daily distances travelled will, on average, be below the energy storage capacity of the vehicles, BEVs become a source of surplus energy which could be used elsewhere, such as for domestic needs or for supplying the national grid14,15.
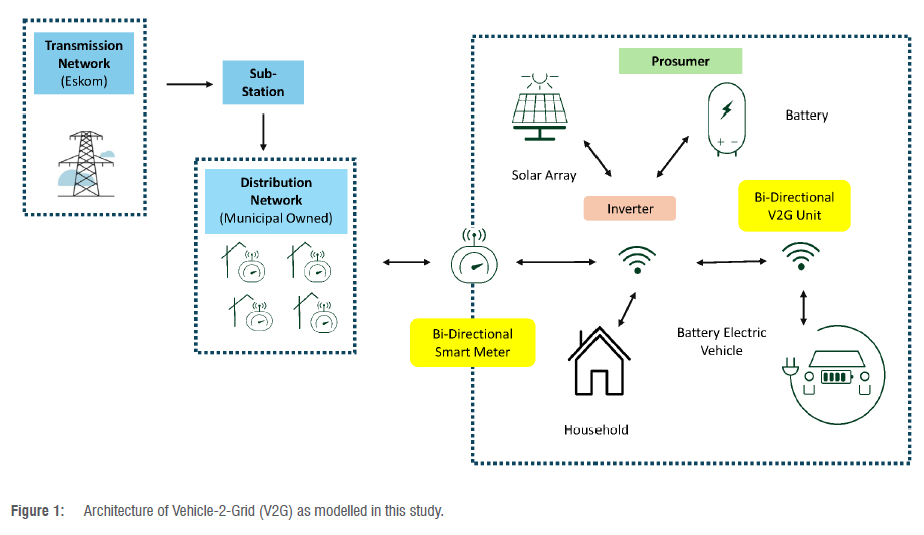
At the core of V2G are two devices: the bidirectional V2G unit, which allows energy charging and discharging, and the bidirectional smart meter, which measures the quantity and calculates the cost of the energy transactions (Figure 1). By supplying energy to a (micro)grid, the vehicle owner can participate in energy trading and earn much-needed income, perhaps up to 12% of the annual equivalent of the car's initial cost.16 Alternatively, the stored energy could be used by vehicle owners to supply their own domestic needs, replacing more expensive energy drawn from the grid during times of peak demand.
V2G can, therefore, play a critical part in load balancing, frequency regulation, acting as a spinning reserve, delivering incentives to owners for the uptake of BEVs, storing excess renewable energy, improving overall grid operations and decreasing the overall electricity cost.5,12,17,18
In a research project, the results of which are reported in this article, the potential of V2G for South Africa was explored in more detail, specifically the development of appropriate hardware and software for V2G, the techno-economic assessment of V2G from a user and system perspective, what strategies could be used to increase acceptance of the technology within South Africa, including necessary policy measures and, finally, how to increase community-level energy security and resilience within a context of increasing energy poverty and insecurity using V2G. The study assumed a behind-the-meter architecture for V2G, as shown in Figure 1.
Literature review
V2G technology and cost
V2G has been under consideration as a useful means of accessing additional energy storage since the late 1990s.15 Compared to small-scale embedded solar (SSES) systems, BEVs are equipped with large batteries. A typical SSES system will deploy a battery capacity of 10 kWh to 20 kWh whereas BEVs have capacities of 40 kWh to 100 kWh. Even for a small country like South Africa, which has a fleet size of about 12 million vehicles19, the total sum of stored energy will amount to 840 GWh, if 100% conversion to BEVs takes place before the 2050 Net Zero date. Given that South Africa has an annual electricity demand of 195 TWh20, the energy stored in BEVs represents about 38 hours of electricity supply for the entire country.
These calculations are presented not to suggest that BEVs could be used as gigawatt-scale energy storage schemes, but rather to highlight that V2G does offer an opportunity for utility companies to access infrastructure necessary to maintain a reliable energy supply without incurring the associated capital costs.5 Such storage could enhance grid stability, mitigate supply/demand imbalances, act as devices for valley filling and peak shaving and regulate electricity frequency.17 The benefits of V2G for vehicle owners, and especially the benefit to cost ratio, are more complicated. Although any additional revenue from energy sales is a clear benefit, it comes at the cost of reduced battery lifetimes and the inconvenience of more careful energy management.5
The adoption of V2G has required significant technological innovation in areas such as the interconnection between the vehicle and the charging/ discharging stations, on-board modulation of the energy format, net metering solutions for vehicle owners and grid operators, and efficient battery management software. Some progress has already been made, and further developments are underway. For instance, several of the larger vehicle manufacturers have already released versions of V2G onto the market:
• Nissan: Nissan will launch its V2G technology in 2026, allowing BEV owners to power their homes during peak times or outages from their vehicle's battery and to sell surplus energy back to the grid.21
• Ford: Ford has launched the Ford F-150 Lightning which is an electric pick-up equipped with bidirectional charging capability and a 100 kWh battery pack.22 Ford is also the co-founder of ChargeScape, a software company that provides the technology to support smart metering and bidirectional energy trading.
• Volkswagen: Volkswagen's ID.4 can discharge power for various applications.23
• Hyundai: Hyundai has developed the Electric-Global Modular Platform which, together with the Integrated Charging Control Unit, can support bidirectional charging.24
• BYD: Many of the BYD models include a standardised facility to supply direct current for V2L applications.
Progress in the development and commercial availability of smart bidirectional meters is more limited. The essential features of bidirectional meters are to measure positive and negative energy flows, allow time-of-use billing and optimise the use of energy according to the cost of the various sources. In Australia, new chargers, such as the Sigenergy's SigenStor and RedEarth's Ambibox DC Wallbox, are entering the market, supporting V2G and V2H.25 In the USA, General Motors offers a complete energy home system including the charger, the power bank and the inverter, with metering capability.
The cost of V2G is still high due to the additional investment in home infrastructure (electrical) and the reduced battery lifespan. For instance, Anil Paryani, Executive Director of Engineering at Ford Motor Company, recently reported that the additional cost of V2G to the prosumer is about ZAR3 per kWh due to the battery replacement charge.26 Other authors are less pessimistic, arguing that the studies are inconclusive and that car manufacturers would not be offering V2G unless the problem of battery lifespan had been solved.3 In this study, a limited degree of degeneration has been included as per a prior techno-economic study of BEVs as distributed energy storage systems.5
V2G frameworks and regulations
China leads the world in BEV sales, as noted in the introduction, and is also one of the leading countries in the adoption of V2G frameworks and regulations with plans for complete V2G integration by 2023.5 The plans include guidelines for the acceleration of national and industry standards for V2G, focusing on interaction interfaces and communication protocols, the development of advanced battery technology to support high cycling usage, the further commercialisation of bidirectional meters, the implementation of time-of-use electricity pricing policies for residential charging facilities, the launch of several V2G demonstration projects in different locations and user communities, and support for electricity grid operators in V2G management and energy trading.27
In South Africa, the context for V2G is framed by two distinguishing features. Firstly, the Eskom generation crisis accelerated the installation of SSES, with the latest estimates indicating that the total installed capacity, excluding utility-scale solar, had exceeded 5 GW by mid-2024.28,29 The second feature is that the installations are highly uneven between income groups, and have further increased the inequality between high- and low-income households.30 The dominant reason for the installation of SSES has not been directly linked to a net zero energy transition but instead to distrust amongst energy customers in the national utility. Future policies to support an e-mobility transition need to increase the uptake of electric vehicles but also ensure an inclusive rate of adoption.31
Similarly, the uptake of BEVs in South Africa remains restricted. According to the National Association of Automobile Manufacturers of South Africa32, 1257 BEVs were sold in South Africa in 2024 (annualised from Q1 2024 data), representing 11% of the sales of all new energy vehicles and only 0.24% of all new vehicle units. Although sales are growing, the volumes are small, as is the charging infrastructure. There are 500 public charging stations, mostly along the major transport routes and in the metropolitan areas.33
South Africa has taken an important step towards incentivising green mobility by introducing a 150% tax incentive for electric and hydrogen vehicle production. The allowance, announced by the Minister of Finance in his 2024 budget speech34 and introduced in 2025, is expected to stimulate the country's nascent BEV industry, encourage investment, and position South Africa as a key regional player in the global shift toward sustainable transport. The new incentive offers manufacturers tax breaks on research, development and production costs, thereby accelerating the domestic production of electric vehicles and hydrogen-powered vehicles, as well as the components needed for their assembly.
In this article, the techno-economics and SSES and BEV ownership, relative to the conventional use of grid-based electricity and internal combustion engine (ICE) vehicles, are explored. The analysis is important firstly to determine whether there is sufficient economic incentive for vehicle owners to opt for BEVs, but secondly to explore the mutual benefits of SSES with BEV as a V2G configuration.
Techno-economic model and use cases
Calculations for levelised costs
The study followed a techno-economic modelling approach based on three separate techno-economic analyses, the levelised cost of energy (LCOE)35,36, LCOD37,38 and the total cost of ownership10. Data for the analysis were obtained from a single photovoltaic system located in the Western Cape, South Africa, monitored over a period of one year.29 The data were imported as hourly values into a spreadsheet and used as the basis for the modelling work on various use cases, as described later.
The three techno-economic approaches are already well described in the literature.36,38 The common feature of the algorithms is to convert all costs into a net present value (total cost of ownership in the case of vehicle ownership), and then divide this amount by the discounted sum of distance travelled, in the case of LCOD, or discounted sum of energy generated/used, in the case of LCOE. The equations for LCOE and LCOD are given below39:
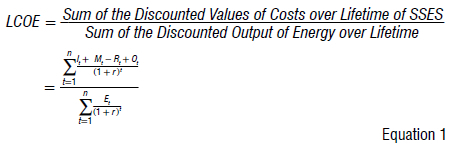
where It = investment expenditure in year t (ZAR), Mt = maintenance and expenditure in year t (ZAR), Rt = energy rebate in year t (ZAR), Ot = operational expenditure in year t (ZAR), r = discount rate, t = year of expenditure (year), n = expected lifetime of the system (years) and Et = energy output in year t (kWh).
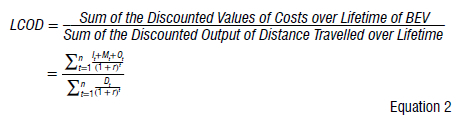
where It, Mt, Ot, t, n, r are as for Equation 1 and Dt = distance driven inyear t (km).
In the calculation of the net energy cost, the grid-related costs - such as the purchase of energy from the grid (based on unit fees) and the connection fees - must be added. The net LCOE is obtained as the weighted average of energy from the SSES and the grid. It is also necessary to adjust for the energy losses due to battery roundtripping and the use of an inverter.40 For the SSES, the overall energy efficiency is about 90%; in other words, 10% of the energy input from the two sources (grid and solar) is lost to the inverter and stationary battery. A similar value is also applied to the energy efficiency of the BEV charging/discharging cycle.
As the final step in the sequence of calculations to support the comparison between the five different use cases explored in this study, the LCOE and LCOD are converted to their respective annual worth (AW) values by multiplying the individual values by the total electricity demand and distance travelled, respectively. AW is a standard financial calculation which reduces all costs to single year values and allows comparative assessment between different options for engineering systems.41
Definition of use cases
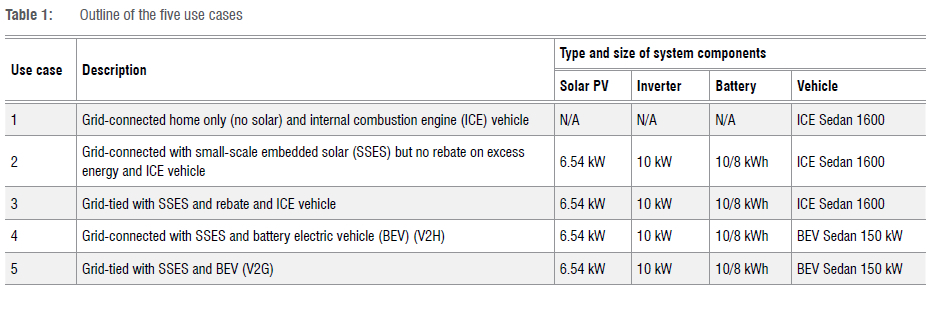
Five different use cases were explored in the modelling studies, as shown in Table 1. It is noted that there is an important difference between grid-tied and grid-connected. The former refers to a grid interface between the SSES and the grid which allows bidirectional flow through a smart meter, whereas the latter only allows unidirectional flow from the grid to the SSES.
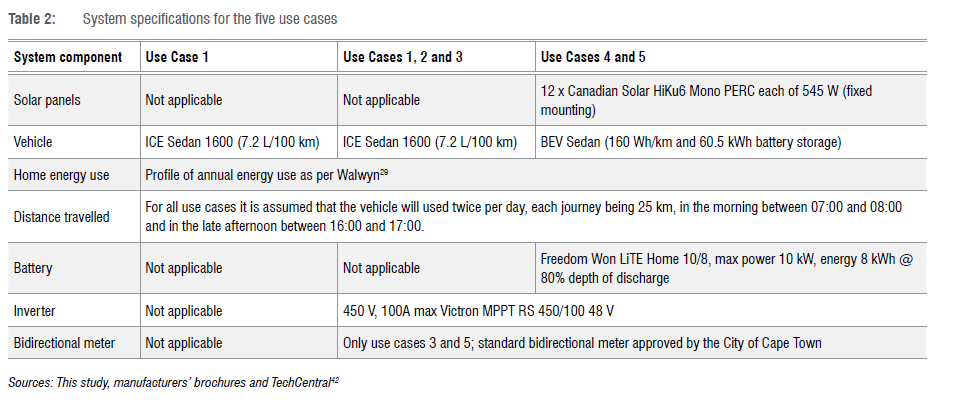
The system specifications for the five use cases are listed in Table 2. There are probably as many use cases as there are users in a national electricity system. Each user will have a different and perhaps unique energy demand, depending on factors such as work patterns, domestic habits, energy budget, location and building design. The model itself was built to accommodate variable patterns of use and solar energy, with the raw data requirement being the hourly values for measured solar irradiance (or potential solar panel output), actual solar energy generated/used, grid consumption and total energy demand.
An important consideration for the analysis is the daily period over which BEV charging will take place. This study has focused on the optimal conditions within which V2G could be economical, making maximum use of the available solar generation and minimising any additional energy demand from the grid. The use cases in this study all assume that BEV charging will take place over the peak solar generation period, as is discussed in more detail below. In this way, drawing additional energy from the electricity grid will largely be avoided, and the homeowner will make maximum use of embedded generation. For a household with an existing SSES, this energy is essentially without cost and is a direct subsidy of the BEV.
The use of the vehicle as assumed in this analysis is based on the pattern of a single car household in which one person works from home and the other members are either at school or need transport to a local place of employment. Serving these needs therefore requires two daily trips, each of 25 km, one early in the morning and one in the late afternoon.
The technical specifications for the vehicles evaluated in the study have been taken from multiple sources including TechCentral42 and manufacturers' brochures (VW Polo Sedan 81kW 1.6 Tipt and BYD Dolphin Premium). These choices are small cars which align with the vehicle use cases as defined in the earlier discussion. The BYD Dolphin Premium is equipped with a 60.5 kWh battery and a V2G discharge adapter.
Financial data
The input financial assumptions as used for the techno-economic modelling have been listed in Table 3. Standard values have been assumed for the common parameters such as project duration, maintenance and capital costs. It is noted that the financial calculations are all based on real 2024 South African rands (ZAR) as the levelised cost methodology cannot deal with inflation. For this reason, the discount rate is a real rate, rather than nominal, and is set at 8.5%.
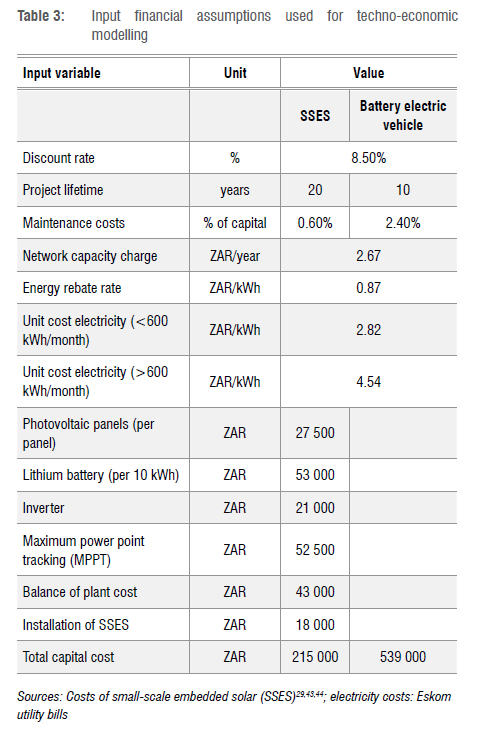
There are two other relevant considerations for this study. Firstly, photovoltaic panel efficiencies are sensitive to heat and decrease over time, as reported in the literature.45 Secondly, battery lifespans are reduced proportional to the number of charge/discharge cycles. The reduction in panel efficiencies has been ignored in the study because the impact is minimal. However, the cost of the battery deterioration has been included by tracking the number of charge/recharge cycles and then adding additional maintenance costs in proportion to the number of necessary replacements over the project period, as per values in the literature.5
The cost of BEVs vs the stationary batteries in SESS make the latter appear overpriced. Battery costs are highly modular - a 20 kWh battery costs double a 10 kWh unit, and so on. A BEV containing 60 kWh of battery storage has the equivalent of ZAR312 000 worth of storage, which is 66% of the full cost of the BEV (in this case for the BYD Dolphin Premium). The price differential suggests that the cost of stationary battery systems will also decrease in the future.
Results
Solar availability and vehicle charging
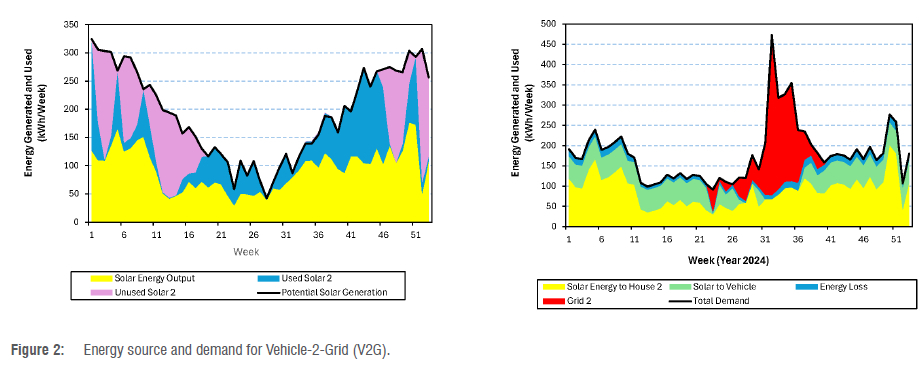
In a prior analysis using the same input date for generation/demand, it has been shown that a typical SSES installation will have as much as 50% excess capacity (unused solar).29 However, the energy is not available at all times of the day; typically, the excess supply will be available between the hours of 10:00 to 16:00, depending on the local climatic conditions, indicating that the optimal BEV charging strategy will be during these hours.
As expected, the additional demand from the BEV reduces energy curtailment during summer and increases the energy drawn from the grid in winter. The latter impact is expected, as the panels are typically sized for zero surplus over the winter period. The predicted profile for energy demand by the two different consumption points (vehicle and household), and the source of energy from which this demand is served, are shown in Figure 2.
Levelised costs and annual worth
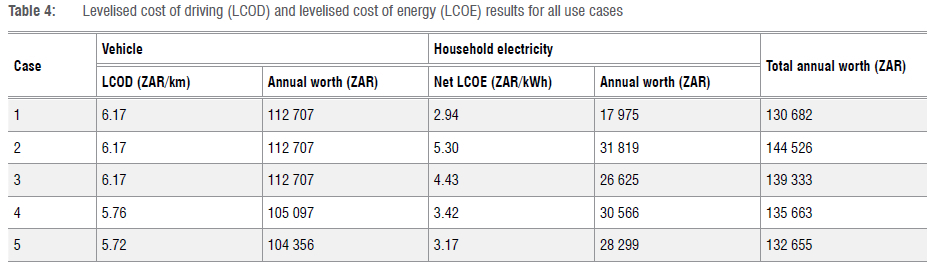
Use Case 1 considers the base conditions under which a household is grid connected, drawing energy directly from the national utility, and uses a 1600 ICE vehicle for domestic use. This option has the lowest cost based on the sum of the AW values for electricity and transport, as shown in Table 4. In other words, the lowest cost option for households able to afford the purchase of a vehicle, regardless of the fuel it uses, is the conventional situation of grid-connected electricity supply and ICE. Interestingly, the cost of mobility is nearly six times higher than the cost of electricity in all cases. The annual fuel cost, in the case of an ICE, alone exceeds the cost of electricity usage.
Use Case 2, in which the household invests in the grid-connected purchase of SSES, is the most costly due to the high LCOE for SESS-generated energy, as already reported.29 In the absence of bidirectional metering and energy rebates, SSES is economically unattractive and its uptake in South Africa has been driven by issues of energy security rather than reduced environmental impact or affordability. The higher energy costs are somewhat mitigated in the case of grid-tied SSES (Use Case 3), which reduces the net energy cost by 16% and increases the solar utilisation from 48% to 100%. However, the total AW remains higher than in Use Case 1.
In summary, SSES based on a set of standard design considerations adds 80% to the annual cost of a household's electricity bill and does not ensure total independence from Eskom. The optimal configuration ensures that the solar panels deliver sufficient energy during a winter's day (sunny conditions) to meet the daily average electricity needs, and that the overall system (panels with the inverter and battery) is sized to meet a fraction of demand served (FDS) value of 80%. The LCOE for a grid-tied SSES is somewhat reduced (17%) by the addition of bidirectional metering and the use of the energy rebate tariffs already in place within many parts of South Africa. The effect would be larger if the rebate value, presently 31% of the standard tariff and 19% of the higher tariff, were to be more generous.
Levelised cost of driving
Use Cases 4 and 5 cover the replacement of the household's ICE with a BEV with or without V2G, respectively. Despite the higher capital cost of the BEV, the reduced fuel and maintenance costs make both uses cases lower cost in terms of LCOD. Although not shown in Table 3, the AW value for an option in which there is no SSES and the BEV is recharged directly from the grid at the lower tariff rate is in fact the lowest AW option, giving a value of ZAR 120 766. (The analogous value at the higher Eskom tariff is ZAR127 015.)
The addition of V2G does mitigate the higher BEV cost, as may be expected, and the AW of Use Case 5 (SESS/BEV/V2G) is almost identical to the base case (Unit Case 1). The similarity is a recent phenomenon; studies earlier than 2020 indicate that BEVs are still expensive relative to the ICE for small households. However, the entry of lower cost vehicles and improvements in V2G integration have improved the techno-economics and BEV ownership and the LCOD values as calculated in this study are not dissimilar to other values already reported in the literature.37
Sensitivity analysis
The values generated in this analysis are sensitive to four main input variables: the lifetime of the BEV batteries under V2G conditions, the cost of battery replacement, the cost of the BEV itself and the future cost of grid-based electricity. With the exception of the latter, all of the former are falling in real terms as the market for energy storage and BEVs expands. For instance, the cost of battery storage fell by 30% over the period 2023 to 2024, and is expected to further decline to 50% of the 2024 value.4 BEVs have also fallen in price and the trend is expected to continue as smaller and less exclusive models are launched.4 Electricity, and particularly grid-based electricity, remains a major concern to long-term affordability and underlines the importance of some degree of energy independence however this is accessed, but preferably through SSES.
In summary, BEVs which are V2G enabled have a dual benefit of improving the economics of SSES and BEV ownership, to the extent that these integrated systems are now comparable in cost (ignoring any consideration of carbon emissions and potential carbon tax) with the option of ICE with grid-based electricity supply.
Discussion
V2G offers several major benefits for future energy systems. It can help increase energy system resilience by reducing reliance on centralised energy generation based on traditional large-scale power plants, it can smooth energy demand, it can promote clean energy usage by harnessing the SSES capacity of home users, and it can subsidise the cost of BEV ownership.
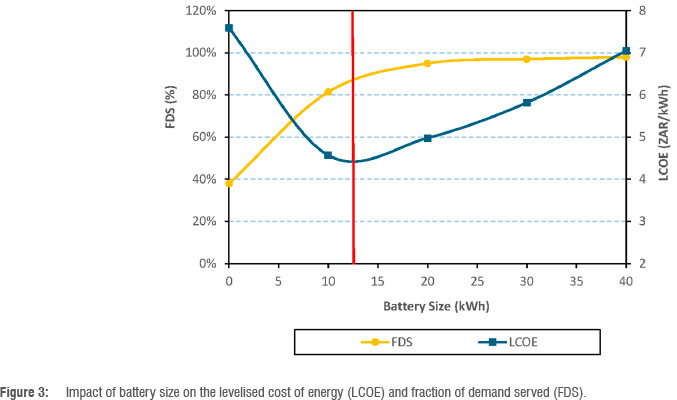
A significant contributor to the high LCOE of SSES is the low consumption of available solar energy. One possible solution to this problem might be to increase the size of the battery storage, enabling greater energy collection during daylight hours and lower dependence on grid-based electricity at night. However, further analysis based on Use Case 3 shows that larger batteries improve the FDS but rapidly increase LCOE, as shown in Figure 3.
It is apparent from this figure that a 10 kWh battery, equivalent to a ratio of about 1.5 relative to the solar panel capacity, is close to the optimum. Lower ratios rapidly reduce FDS and increase LCOE, whereas larger capacities only marginally increase FDS but quickly increase LCOE, confirming the empirical rule that the optimal battery capacity equates to a FDS value of 80% to 85%. In other words, on the basis that the annual household electricity demand is about 16.5 kWh/day, as is the case in this study, a usable battery capacity of 80% of the nameplate value, a FDS of 80%, a night-to-day usage split of 1:1 and a net solar panel efficiency of 8.5%, results in a system specification of a peak panel capacity at 6.5 kW and battery capacity of 8/10 kWh.
V2G offers an alternative approach. By 'selling' SSES energy to the vehicle, and reducing refuelling costs which would otherwise be incurred, the overall LCOE is reduced. Such a strategy has been demonstrated with Use Case 5, which showed that the energy storage capability of the BEV can be used to increase the overall utilisation of energy availability in the SSES without adversely affecting the utility of either component of the household infrastructure.
This result is particularly relevant to the Western Cape with its greater diversity between winter and summer solar irradiance conditions.46,47 As already noted, SSES systems tend to be sized for cloudy winter conditions, implying that a large amount of excess solar is available in the hot summer months, which can be usefully stored in a BEV. A similar conclusion, but with a lower net benefit, can also be reached for systems in all regions of South Africa.
Despite this benefit (valorisation of SSES), there are multiple challenges to the adoption of V2G - the most important of which is consumer and motor manufacturer resistance arising from the additional cycling of the batteries and associated components, leading to the accelerated depreciation of these assets, and, of course, additional costs. There are already some solutions to this problem, such as lower battery costs, selection of batteries appropriate to V2G and state of charge management systems.48 Clearly, battery ageing over time, known as calendar ageing, is unavoidable. Cycle ageing, however, is a function of the depth and number of charge/discharge cycles and can be managed.49 From the perspective of the vehicle owner, the 20-30% reduction in battery lifetime over the duration of ownership needs to be counterbalanced by earnings from the grid operator.
Given that there is little incentive for the vehicle manufacturers to develop these protocols and systems, because V2G is an 'off-label' use of their products, V2G will only proceed if governments, through clear legislative frameworks, drive public interest research to ensure consumer protection and awareness, robust cybersecurity and energy market participation.1
Conclusion
Prior studies have reported that V2G technology holds considerable potential for revolutionising energy management and transportation, reducing energy and transport inequalities and accelerating the attainment of Net Zero.3 However, many of these articles are not supported by the analysis of empirical data, allowing for a direct, quantitative comparison of the conventional ICE/grid connection vs V2G. This study provides such an analysis. Real-time data, collected from a single SSES, have been used as the input values into a techno-economic model, allowing for the comparison of five different use cases, covering various combinations of household electricity supply and vehicle technology, including V2G.
The analysis shows that SSES/BEV combinations are more expensive than the base case (ICE with grid supply), but V2G only marginally so. The latter almost achieves cost parity to ICE/grid, giving a total AW of ZAR132 655 vs ZAR130 682, whereas the option of BEV/grid is 5% higher.
The relatively small differences between the use cases suggest that economic factors alone are unlikely to adequately incentivise BEV uptake. Despite the advantages of V2G and BEVs in a sustainable energy future, their widespread adoption faces several challenges which must be addressed through collaboration between industry stakeholders, policymakers and regulators. In terms of further work, improvements to battery cycle life are necessary, and further research is required to assess a more diverse range of battery materials. Moreover, the South African government needs to implement the policy actions of its Electric Vehicles White Paper which include the scale up of investment in charging infrastructure, supporting localisation, expanding grid capacity and introducing consumer incentives.50
Acknowledgements
I acknowledge the support of the National Research Foundation (NRF) through the South African/German Collaborative Research Programme (SAG-CORE).
Funding
The South African National Research Foundation funded the broader project on 'Deployment of Vehicle to Grid for Decarbonisation, Resilience and Sustainability' within which this study took place.
Data availability
The data supporting the results of this study are available upon request to the corresponding author.
Declarations
I have no competing interests to declare. I have no AI or LLM use to declare.
References
1. Tahir M, Hu S, Zhu H. Strategic operation of electric vehicle in residential microgrid with vehicle-to-home features. Energy. 2024;308, Art. #132772. https://doi.org/10.1016/j.energy.2024.132772 [ Links ]
2. Wang L, Sharkh S, Chipperfield A. Optimal coordination of vehicle-to-grid batteries and renewable generators in a distribution system. Energy. 2016; 113:1250-1264. https://doi.org/10.1016/j.energy.2016.07.125 [ Links ]
3. Letcher M, Britton J. The role of electric vehicle-to-X in net zero energy systems: A comprehensive review. Energy Res Soc Sci. 2025;122, Art. #104021. https://doi.org/10.1016/j.erss.2025.104021 [ Links ]
4. International Energy Agency (IEA). Global EV Outlook 2025. Geneva: IEA; 2025. [ Links ]
5. Geng J, Hao H, Hao X, Liu M, Dou H, Liu Z, et al. Techno-economic comparison of vehicle-to-grid and commercial-scale battery energy storage system: Insights for the technology roadmap of electric vehicle batteries. World Electr Veh J. 2025;16(4), Art. #200. https://doi.org/10.3390/wevj16040200 [ Links ]
6. De Cauwer C, Maarten M, Heyvaert S, Coosemans T, Van Mierlo J. Electric vehicle use and energy consumption based on realworld electric vehicle fleet trip and charge data and its impact on existing EV research models. World Electr Veh J. 2015;7(3):436-446. https://doi.org/10.3390/wevj7030436 [ Links ]
7. Huda M, Koji T, Aziz M. Techno economic analysis of vehicle to grid (V2G) integration as distributed energy resources in Indonesia power system. Energies. 2020;13(5), Art. #1162. https://doi.org/10.3390/en13051162 [ Links ]
8. Walwyn D. Fact or fiction: Do battery electric vehicles really save costs? Innovate. 2020;14:82-84. [ Links ]
9. Wang Z, Acha S, Bird M, Sunny N, Stettler MEJ, Wu B, et al. A total cost of ownership analysis of zero emission powertrain solutions for the heavy goods vehicle sector. J Clean Prod. 2024;434, Art. #139910. https://doi.org/10.1016/j.jclepro.2023.139910 [ Links ]
10. Liu Z, Song J, Kubal J, Susarla N, Knehr KW, Islam E, et al. Comparing total cost of ownership of battery electric vehicles and internal combustion engine vehicles. Energy Policy. 2021;158, Art. #112564. https://doi.org/10.1016/j.enpol.2021.112564 [ Links ]
11. Tan KM, Ramachandaramurthy VK, Yong JY Integration of electric vehicles in smart grid: A review on vehicle to grid technologies and optimization techniques. Renew Sustain Energy Rev. 2016;53:720-732. https://doi.org/10.1016/j.rser.2015.09.012 [ Links ]
12. Tara Energy. Vehicle-to-grid (V2G): Revolutionizing energy and transportation [webpage on the Internet]. No date [cited 2025 Jan 20]. Available from: https://taraenergy.com/blog/vehicle-to-grid-revolutionizing-energy-and-transportation/ [ Links ]
13. Cogill R, Gallay O, Griggs W, Lee C, Nabi Z, Ordonez R, et al. Parked cars as a service delivery platform. In: Proceedings of the 2014 International Conference on Connected Vehicles and Expo (ICCVE); 2014 November 3-7; Vienna, Austria. IEEE; 2014. p. 138-143. https://doi.org/10.1109/ICCVE.2014.7297530 [ Links ]
14. Patankar PP, Rather ZH, Nath A, Liebman A, Doolla S. Vehicle-to-home and vehicle-to-building: A techno-economic analysis under varying charging methods and tariff. IEEE Trans Transp Electrif. 2024;11:6355-6367. https://doi.org/10.1109/TTE.2024.3508265 [ Links ]
15. Pearre NS, Ribberink H. Review of research on V2X technologies, strategies, and operations. Renew Sustain Energy Rev. 2019;105:61-70. https://doi.org/10.1016/j.rser.2019.01.047 [ Links ]
16. Li Z, Chowdhury M, Bhavsar P He Y Optimizing the performance of vehicle-to-grid (V2G) enabled battery electric vehicles through a smart charge scheduling model. Int J Automot Technol. 2015;16(5):827-837. https://doi.org/10.1007/s12239-015-0085-3 [ Links ]
17. Fathabadi H. Utilization of electric vehicles and renewable energy sources used as distributed generators for improving characteristics of electric power distribution systems. Energy. 2015;90:1100-1110. https://doi.org/10.1016/j.energy.2015.06.063 [ Links ]
18. Boudina R, Wang J, Benbouzid M, Khoucha F, Boudour M. Impact evaluation of large scale integration of electric vehicles on power grid. Front Energy. 2020;14:337-346. https://doi.org/10.1007/s11708-018-0550-6 [ Links ]
19. Colin-on-Cars. Revealed: The true numbers behind South Africa's car industry in 2025 [webpage on the Internet]. c2025 [cited 2025 Oct 23]. Available from: https://colin-on-cars.com/2025/02/21/revealed-the-true-numbers-behind-south-africas-car-industry-in-2025 [ Links ]
20. International Energy Agency. Where does Africa get its electricity? [webpage on the Internet]. No date [cited 2024 Sep 28]. Available from: https://www.iea.org/regions/africa/electricity [ Links ]
21. Nissan. Nissan to roll-out V2G technology from 2026 [webpage on the Internet]. c2024 [cited 2025 Oct 23]. Available from: https://www.group1nissan.co.za/blog/nissan-electric-vehicles/nissan-v2g-technology/ [ Links ]
22. Nina R. Ford F-150 Lightning and revolutionary bidirectional charging [webpage on the Internet]. c2023 [cited 2025 Jan 20]. Available from: https://www.wayneakersford.com/ford-f-150-lightning-and-revolutionary-bidirectional-charging/ [ Links ]
23. Virta. Everything you need to know about V2G [webpage on the Internet]. No date [cited 2025 Jan 01]. Available from: https://www.virta.global/vehicle-to-grid-v2g [ Links ]
24. Shields N. How bidirectional charging can power your world [webpage on the Internet]. c2023 [cited 2025 Jan 20]. Available from: https://www.hyundai.news/eu/articles/stories/how-bidirectional-charging-can-power-your-world.html [ Links ]
25. Svarc J. Bidirectional EV chargers review [webpage on the Internet]. c2025 [cited 2025 May 20]. Available from: https://www.cleanenergyreviews.info/blog/bidirectional-ev-chargers-review [ Links ]
26. Proffitt K. Ford's vision for a vehicle-to-grid future [webpage on the Internet]. c2025 [cited 2025 May 20]. Available from: https://www.batterypoweronline.com/news/fords-vision-for-a-vehicle-to-grid-future/ [ Links ]
27. Chinese National Development and Reform Commission. Opinions on the strengthening of new energy vehicles and power grid integration. Beijing: The State Council of the People's Republic of China; 2024. [ Links ]
28. Dippenaar JA, Bekker B. Understanding interconnection rule non-compliance: Lessons from South Africa's surge in unauthorised distributed energy resources. Energy Sustain Dev. 2025;85, Art. #101661. https://doi.org/10.1016/j.esd.2025.101661 [ Links ]
29. Walwyn DR. An alternative to higher energy tariffs: Extracting unused capacity from small-scale embedded solar. S Afr J Sci. 2026;122(1/2), Art. #21603. https://doi.org/10.17159/sajs.2026/21603 [ Links ]
30. Venter ZS, Chivanga S, Davies M, Monyai P Scott SL. Darkening nights and rooftop solar adoption under South Africa's electricity crisis: Geographies of the energy apartheid. Environ Res Energy. 2025;2(2), Art. #025006. https://doi.org/10.1088/2753-3751/adcb4a [ Links ]
31. Montmasson-Clair G. Towards an inclusive rollout of electric vehicles in South Africa. Pretoria: Trade & Industrial Policy Strategies; 2022. [ Links ]
32. National Association of Automobile Manufacturers of South Africa. South Africa's electric car sales surge [webpage on the Internet]. c2024 [cited 2025 Oct 28]. Available from: https://naamsa.net/south-africas-electric-car-sales-surge/ [ Links ]
33. Govender J. Charging ahead: A 2025 guide to EV charging stations across South Africa [webpage on the Internet]. c2025 [cited 2025 Oct 28]. Available from: https://auto24.co.za/blog/charging-ahead-a-2025-guide-to-ev-charging-stations-across-south-africa [ Links ]
34. Godongwana E. 2024 Budget speech. Cape Town: National Treasury; 2024. [ Links ]
35. CFI. Levelized Cost of Energy (LCOE) [webpage on the Internet]. No date [cited 2021 Mar 19]. Available from: https://corporatefinanceinstitute.com/resources/knowledge/finance/levelized-cost-of-energy-lcoe/ [ Links ]
36. Aldersey-Williams J, Rubert T. Levelised cost of energy - A theoretical justification and critical assessment. Energy Policy. 2019;124:169-179. https://doi.org/10.1016/j.enpol.2018.10.004 [ Links ]
37. Canada Energy Regulator. Market snapshot: Levelized costs of driving EVs and conventional vehicles [webpage on the Internet]. c2019 [cited 2025 May 19]. Available from: https://www.cer-rec.gc.ca/en/data-analysis/energy-markets/market-snapshots/2019/market-snapshot-levelized-costs-driving-evs-c onventional-vehicles.html [ Links ]
38. NREL. Levelized cost of driving assumptions [webpage on the Internet]. c2024 [cited 2025 May 19]. Available from: https://atb.nrel.gov/transportation/2024/levelized_cost_of_driving_assumptions [ Links ]
39. Arias-Cazco D, Rozas H, Jimenez D, Orchard ME, Estevez C. Unifying criteria for calculating the levelized cost of driving in electro-mobility applications. World Electr Veh J. 2022;13(7), Art. #119. https://doi.org/10.3390/wevj13070119 [ Links ]
40. Lai CS, McCulloch MD. Levelized cost of electricity for solar photovoltaic and electrical energy storage. Appl Energy. 2017;190:191-203. https://doi.org/10.1016/j.apenergy.2016.12.153 [ Links ]
41. Park CS. Contemporary engineering economics. 6th ed. Harlow: Pearson Education Limited; 2016. [ Links ]
42. TechCentral. All the electric cars for sale in South Africa in 2025 - with prices [webpage on the Internet]. c2025 [cited 2025 May 20]. Available from: https://techcentral.co.za/electric-cars-for-sale-in-south-africa/257624/ [ Links ]
43. Scholtz A, Koekemoer O, Roopa M. Lighting the way to profitable recharging: A techno-economic analysis of workplace solar-powered electric vehicle chargers in Potchefstroom, South Africa. In: Proceedings of the 34th Conference of the Southern African Institute for Industrial Engineering (SAIEE); 2024 October 14-16; Vanderbijlpark, South Africa. Pretoria: SAIEE; 2024. p. [57]1-[57]17. [ Links ]
44. Palmer K, Tate JE, Wadud Z, Nellthorp J. Total cost of ownership and market share for hybrid and electric vehicles in the UK, US and Japan. Appl Energy. 2018;209:108-119. [ Links ]
45. Chudy M, Mwaura J, Walwyn D, Lalk J. The effect of increased photovoltaic energy generation on electricity price and capacity in South Africa. In: AFRICON 2015; 2015 September 14-17; Addis Ababa, Ethiopia. IEEE; 2015. p. 1-6. https://doi.org/10.1109/AFRCON.2015.7331968 [ Links ]
46. Boateng L, Mhangara P A comparative assessment of annual solar irradiance trends between Mpumalanga and Northern Cape Province in South Africa using PVGIS. Energies. 2023;16(18), Art. #6665. https://doi.org/10.3390/en16186665 [ Links ]
47. Singh J. Ranking South African provinces on the basis of MERRA 2D surface incident shortwave flux. J Energy South Afr. 2016;27(3):50-57. https://doi.org/10.17159/2413-3051/2016/v27i3a1555 [ Links ]
48. Lehtola T. Vehicle-to-grid applications and battery cycle aging: A review. Renew Sustain Energy Rev. 2025;208, Art. #115013. https://doi.org/10.1016/j.rser.2024.115013 [ Links ]
49. Ahmadian A, Sedghi M, Elkamel A, Fowler M, Aliakbar Golkar M. Plug-in electric vehicle batteries degradation modeling for smart grid studies: Review, assessment and conceptual framework. Renew Sustain Energy Rev. 2018;81:2609-2624. https://doi.org/10.1016/j.rser.2017.06.067 [ Links ]
50. Department of Trade Industry and Competition (DTIC). Electric Vehicles White Paper. Pretoria: DTIC; 2023. [ Links ]
 Correspondence:
David Walwyn
Email: david.walwyn@up.ac.za
Received: 21 July 2025
Revised: 28 Oct. 2025
Accepted: 11 Nov. 2025
Published: 29 Jan. 2026
Editor: Thywill Dzogbewu
Funding: South African National Research Foundation