


Services on Demand
Journal

Article
 English (pdf)
 Article in xml format
 Article references
 Send this article by e-mail
Indicators
Related links
-
 Cited by Google
 -
 Similars in Google
Share

 Permalink
South African Journal of Chemistry
On-line version ISSN 1996-840XPrint version ISSN 0379-4350
S.Afr.j.chem. (Online) vol.79 Durban 2025
https://doi.org/10.17159/0379-4350/2025/v79a11
RESEARCH ARTICLE
Unraveling the Dynamic Landscape of α-Glucosidase: A Molecular Dynamics Approach to enzyme stability and Function
Şenol Topuz; Kadir Demir; Hakan Alici*
Zonguldak Bülent Ecevit University, Faculty of Science, Department of Physics, Zonguldak, Türkiye
ABSTRACT
α-Glucosidase is an important biocatalyst in carbohydrate metabolism by hydrolyzing disaccharide into glucose. This enzyme crucially regulates postprandial blood sugar levels. Hence, these features positioned it as a possible target for diabetes therapy and highlight its relevance for therapeutic purposes. But conventional experimental techniques are not adequate for a thorough understanding of the structural and dynamic characteristics of the enzyme at the atomic level and thus frequently lack the capacity to characterize those protein conformational changes that are required for function. Here, we performed MD simulations to explore the structural and dynamic properties of α-glucosidase on an atomistic level. The analyses suggested that a delicate balance exists between rigid core regions, which maintain enzyme integrity, and dynamic surface regions, most notably near the active site. It was also observed that residues within the core structure of enzyme were highly stable. and key molecular interactions, such as hydrogen bonds and salt bridges, were shown to play a vital role to maintain structural integrity. Furthermore, dynamic residues and regions have been identified necessary to bind substrates and inhibitors. In conclusion, the findings of the study provide valuable insights into the functional dynamics of α-glucosidase and hence they can help deepen our understanding of its role in metabolic diseases. In this regard, the obtained outcomes can not only enhance the basic understanding of α-glucosidase structure-function relationship, but they can also pave the way for the design of new therapeutic strategies in diabetes and associated pathologies.
Keywords: α-glucosidase, Molecular dynamics simulations, Structural stability, Diabetes
INTRODUCTION
Carbohydrate metabolism is a fundamental process in living organisms. It is responsible for the breakdown of complex sugars into glucose, a primary energy source. α-glucosidase is at the heart of this process and a vital enzyme that catalyzes the hydrolysis of disaccharides and oligosaccharides into glucose units.1,2,3 α-glucosidase is predominantly active in the small intestine and plays a central role in regulating blood sugar levels after meals. This makes it indispensable for maintaining metabolic balance.3,4 Given its fundamental biological function, α-glucosidase has taken significant attention as a therapeutic target, particularly in the management of type 2 diabetes meHitus (a chronic condition affecting millions globally).4-5-6
In this context- for type 2 diabetes- α-glucosidase inhibitors have proven to be effective in delaying carbohydrate digestion and thereby they reduce the rapid rise in postprandial blood glucose levels.6-7 This mechanism also offers a strategic approach both to improving glycemic control and preventing long-term complications associated with diabetes.4-8 Additional to diabetes- α-glucosidase also plays a significant role in other metabolic and genetic disorders- such as lysosomal storage diseases like Pompe disease. In these cases- enzyme dysfunction leads to the accumulation of glycogen in tissues- and this accumulation results in severe physiological and neurological symptoms.9-10-11 Understanding the structural and functional dynamics of α-glucosidase is thus critical not only for developing targeted treatments for diabetes but also for addressing broader metabolic disorders.5-6
However- despite its medical and biochemical relevance- the molecular mechanism governing the structural flexibility and stability of α-glucosidase is still not fully understood. This is largely due to the limitations of conventional experimental techniques- which provide static structural snapshots but often fail to capture dynamic motions essential for enzyme function.12 In this regard- molecular dynamics (MD) simulations offer a powerful and complementary approach that enables the exploration of time-resolved- atomistic-level conformational changes in proteins.13 By simulating realistic physiological environments- MD simulations can reveal how α-glucosidase responds to substrate binding- structural fluctuations-and catalytic transitions factors that are crucial for its biological activity.14 Thus- integrating MD into the study of α-glucosidase not only helps to bridge the gap between structure and function but also offers a rational basis for structure-based drug design.
Although the biological importance of α-glucosidase is well established- its structural and dynamic properties are still poorly understood and it remains an active area of research.1-15-16 At this point- experimental techniques- such as X-ray crystallography and nuclear magnetic resonance (NMR)- etc.- have provided static snapshots of the enzymes structure.17-18 However- these methods are often inadequate to capture the dynamic conformational changes and interactions that occur under various physiological conditions.17-18 Therefore- the dynamic information in understanding enzyme processes such as flexibility- substrate binding- catalysis and product release remains a mystery.19 Traditional structural techniques such as X-ray crystallography and nuclear magnetic resonance (NMR) have significantly contributed to understanding the static structures of biomolecules.. In this respect- MD simulations can enable us to explore how enzymes such as α-glucosidase maintain structural stability and to reach the significant dynamic information required for their biological function.15-17 Moreover- these dynamic insights from MD are critical for understanding how the active site of the enzyme adapts to different substrates in the binding process and how structural fluctuations in the enzyme affect catalytic efficiency.19-20
In view of the literature- the present study aims to address the existing gap in the research regarding the structural and dynamic features of the α-glucosidase enzyme. To this end- this research employs the molecular dynamics (MD) simulation method to elucidate the balance between stability and flexibility that underlies the biological activity of the enzyme. Furthermore, special emphasis is placed on the identification of regions that are critical for substrate recognition and inhibitor binding and therefore show significant structural adaptability.4,5,6,20 Because identification of these regions is not only fundamental for clarifying the enzyme's function but also offers practical implications for drug design.6,7,8 Also, by integrating computational approaches with existing biochemical knowledge, this study can provide a deeper understanding of dynamic nature of α-glucosidase at the molecular level. Hence the obtained insights can be contributed to the ongoing efforts in designing effective inhibitors for diabetes treatment and lead new viewpoints for studying other enzymes with similar biological roles. 15,19 As a result, the findings of the study are expected to provide significant insights into α-glucosidase's role in substrate recognition and inhibitor binding and to offer a robust viewpoint for the development of innovative therapeutic strategies targeting diabetes and other metabolic disorders.
MATERIALS AND METHODS
The three-dimensional crystal structure of the α-glucosidase enzyme was obtained from the Protein Data Bank (PDB) with the code 3WY1.20 When compared with the data from the UniProt database, it was determined that the first three amino acids were missing in this structure.21 In this context, the missing amino acids were added to the 3WY1 PDB structure using the Discovery Studio 2024 Visualizer program.22 Thus, a completed 3WY1 model was obtained and was utilized as the starting structure for MD simulations.
MD simulations were performed using the GROMACS software package.23 In the simulation, the CHARMM36 force field,24 known for its high compatibility with biomolecular systems,16 was used to define atomic interactions within the protein structure.24 Next, the enzyme was positioned at the center of a cubic simulation box with dimensions of 103.7 x 103.7 x 103.7 Å with a minimum distance of 10 Å between the protein atoms and the box. Afterwards, the simulation system was solvated using the TIP3P water model, which is the most compatible water model with the CHARMM36 force field.25 Accordingly, a total of 34,096 water molecules were added to the simulation box. After that, to mimic physiological conditions, Na and Cl ions were added to achieve a concentration of 0.150 M, and also the system was neutralized using the "genion" module. In the event, this resulted in the addition of 133 Na+ ions and 101 Cl- ions. Then, energy minimization using by steepest descent and conjugate gradient methods was performed to eliminate any steric clashes or inappropriate atomic orientations. Also, periodic boundary conditions (PBC) were applied in all directions, and long-range electrostatic interactions were calculated using the particle-mesh Ewald (PME) method.26,27
The energy minimized structure was subjected to a two-step equilibration simulation of 10 ns each to achieve a steady state in phase space. In the first step of them, the system was equilibrated under NVT ensemble conditions and accordingly the temperature was kept constant at 310 K with the v-rescale thermostat.28 In the second step, equilibration was performed under NPT ensemble conditions, with a constant pressure of 1 bar using the Parrinello-Rahman barostat at 310 K.29 Thus, the stable temperature and pressure values during these equilibration phases allowed the protein to adapt structurally to the environmental conditions.
After equilibration stages, a 300 ns production simulation was performed under NPT conditions at a constant pressure of 1 bar and 310 K. In the equilibration and production phases, the v-rescale thermostat with a coupling constant of 0.1 ps and the Parrinello-Rahman barostat with a coupling constant of 1 ps were employed. Also, a 2 fs integration timestep was used for all simulations, and the Verlet algorithm was utilized for numerical integration.30 In the simulations, MD trajectories were saved every 10 ps to enable a detailed analysis of the α-glucosidase's dynamic behavior, structural stability, and responses to environmental factors under physiological conditions.
RESULTS AND DISCUSSIONS
Structural Stability Analysis: RMSD and Radius of Gyration (Rg)
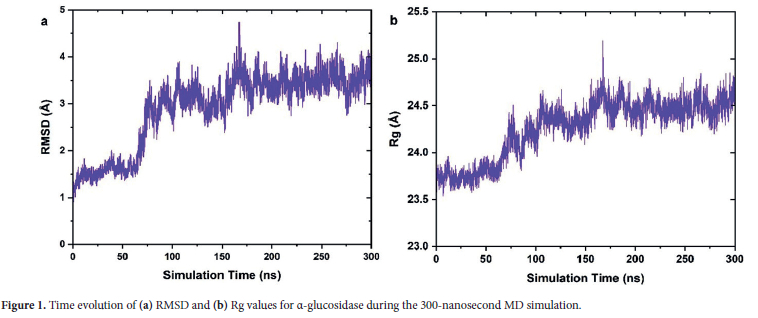
The present study was conducted to investigate the structural and dynamic properties of the α-glucosidase enzyme. To this end, a root mean square deviation (RMSD) analysis was first carried out to evaluate the conformational deviations of the protein throughout the simulation. The obtained RSMD values are depicted in Figure 1a. The RMSD provides a quantitative measure of how the conformation of α-glucosidase structurally deviates from its initial (native) configuration throughout the molecular dynamics simulations. This hence allows us to gain significant inferences associated with the stability and conformational dynamics of the protein.
Examining the RMSD values throughout the simulation, it was observed that at the beginning of the simulation, the RMSD values increase rapidly to -1.6 Å in a very short time and remain stable at this level for the first 60 ns. This initial increase can indicate that the protein adapted to the simulation conditions by moving away from its native structure and thus, α-glucosidase moves to a new conformational state. In other word, it can be said that the rapid increase of RMSD is an indicator of the transition of the protein from its initial unstable configuration to a more dynamic state. Hence, this period can be evaluated as the protein's initial unstable transition period. After 60 ns, it is observed that the RMSD values increase to around 3 Å and exhibit significant fluctuations. Here, particularly between 80 ns and 180 ns, sudden changes in the RMSD were seen. This situation suggests that the protein underwent notable conformational transitions or that flexible regions displayed increased movement. In other words, it can be said that during this time interval, the protein tries to shift its conformational states and seeks to achieve a full stable configuration. After 180 ns, at the end of the simulation, the RMSD values fluctuated around 3.5 Å and stabilized at a relatively more consistent level. These observations suggest that under the simulation conditions, the, α-glucosidase reached a stable conformation and maintained its equilibrium in this conformational state.
To elucidate the details of the observed conformational changes, we then performed the Radius of gyration (Rg) analysis, which enables an evaluation of the structural compactness and folding state of the protein throughout simulation. The Rg analysis measures the spatial distribution of a proteins atoms around its center of mass and thus it allows the evaluation of its overall compactness. In this regard, an increase in Rg values indicates that the proteins conformation has expanded, while a decrease signifies that it has contracted. The calculated Rg values are illustrated in Figure 1b.
For the α-glucosidase enzyme, the native Rg value was 23.3 Å. When the changes in Rg values throughout the simulation were examined, it was observed that the Rg rapidly increase ≈ 23.8 Å and remain relatively stable for the first 60 ns. This early increase similar to RMSD values indicates that the protein adapted to the simulation conditions, and it shifted from its initial compact state to a more expanded structure. After 60 ns, it is seen in the figure that the Rg value gradually increases further with significant fluctuations and reaches ≈ 24.3 Å. Notably, fluctuations are more pronounced between 100 ns and 180 ns. During this time period, it can be considered that the structural stability of the protein was not fully established, and the protein underwent various conformational changes to adapt to the simulation conditions. After 180 ns, the Rg value stabilized around 24.5 Å and this indicates that the protein reached equilibrium in a more expanded conformation.
Overall, the RMSD and Rg profiles followed similar trends. These parallel trends in RMSD and Rg values suggest that the observed deviations may be related to gradual structural expansion and conformational adjustments in α-glucosidase during the simulation. In summary, the RMSD and Rg analyses collectively indicate that the enzyme maintains overall structural stability during the simulation, with no significant unfolding or large-scale conformational deviations.
Residue Flexibility Assessment: RMSF and Solvent Accessibility (SASA)
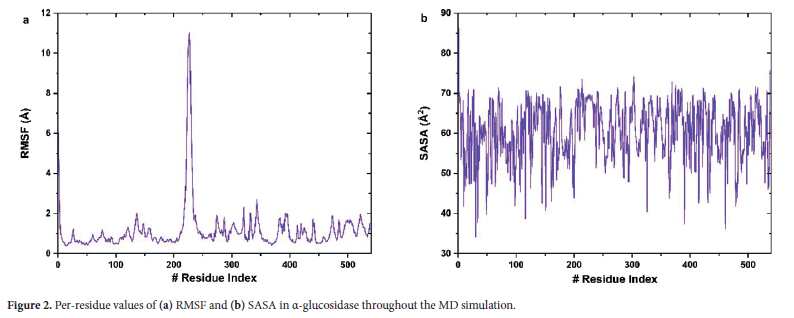
The performed RMSD and Rg analyses have revealed the overall structural changes and conformational transitions ofthe protein during the simulation. However, while these analyses provide information on the general movements of the protein, they are insufficient to evaluate the mobility of specific amino acids or regions. Therefore, to scrutinize the flexibility and mobility of different regions of the protein in greater detail, a Root Mean Square Fluctuation (RMSF) analysis was performed. the calculated RMSF results are depicted in Figure 2a.
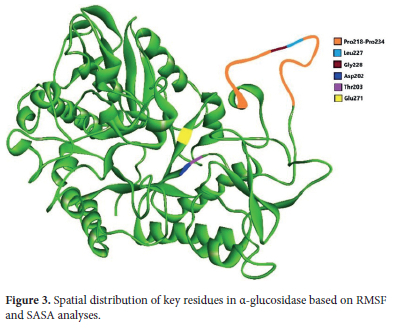
In the α-glucosidase structure, the residues Asp202 and Glu271 are located in the catalytic active site and hence, they play a crucial role in the hydrolysis of substrates.20 Since these residues are part of a stable region, it is expected that they exhibit low mobility in the RMSF analysis. According to our simulation results, Asp202 and Glu271 show low flexibility values (Asp202 = 0.54 Å and Glu271 = 0.82 Å) and the results is consistent with this expectation. Considering this, it can be said that this low mobility indicates that these residues remain stable to ensure substrate binding and catalytic function. Also, Shen et al.20 reported that catalytic residues within the active site of the α-glucosidase exhibit low flexibility to maintain stability and facilitate precise substrate interactions. Our simulation findings also have a coherence with this observation. Another important residue in active site for substrate binding is Thr203. According to the simulation results, Thr203 displayed moderate flexibility. This moderate flexibility may be related to its role in substrate binding.
On the other hand, the Pro218-Pro234 region is described as a long loop that caps the entrance of the active site in the α-glucosidase enzyme.20 This loop contributes to the enzyme's disaccharide specificity which is sterically hindering the binding of long-chain substrates. As can be seen in the figure, the high RMSF values in the Pro218-Pro234 region of α-glucosidase indicate importance of this loop region in regulating access to the active site. In other words, it can be said that this loop provides the structural flexibility necessary for substrate binding and has a key role as a dynamic barrier facilitating substrate interactions at the active site. This observation are consistent with findings by Lemay-St-Denis et al..17 They reported the functional importance of loop flexibility in α-glucosidase enzyme adaptability and activity. The results presented here confirm the above-mentioned inferences and show that this loop undergoes several dynamic conformational adjustments to regulate substrate access and catalytic efficiency under physiological conditions.
On the other hand, the Leu227 and Gly228 residues in the middle of this loop are located in the center of its entry in the active site and thus control the entry. These residues are also located close to the active site, and it can therefore be considered to play an important role in enzyme-substrate interactions. According to simulation results these residues showed the highest RMSF values. This finding suggests that Leu227 and Gly228 residues have structural and functional properties that require considerable flexibility. Therefore, it can be said that these residues have a critical role in contributing to the necessary conformational changes during substrate interaction. Thus, these residues in loop region likely play a dynamic role in facilitating substrate binding and conformational adaptation in the active site. Also, these functional role of surface residues are coherence with reported findings by Azam et al.,5 who highlighted the significance of surface flexibility in enhancing substrate accessibility.
In summary, the binding regions in the α-glucosidase enzyme structure are supported by the flexibility properties observed in the RMSF analysis. Notably, the low mobility of catalytic residues such as Asp202 and Glu271 indicates that these regions maintain stability to facilitate enzymatic reactions. Meanwhile, it can be inferred that the flexibility of the Pro218-Pro234 loop in the RMSF analysis supports the structural adjustments required for substrate recognition and binding and thus they play a critical role in the enzyme's function. The findings of Azam et al. provide foundational insights into the structural stability of α-glucosidase and revealing critical regions of flexibility.5 Compared to their results, our analysis identifies also additional specific residues contributing to substrate recognition and conformational adaptation under physiological conditions.
The flexibility data obtained in the RMSF analysis revealed the dynamic nature and mobility of specific regions within the protein. To examine the contribution of the solvent accessibility of the protein to this mobility of the protein, a Solvent Accessible Surface Area (SASA) analysis was performed, and the obtained results are presented in Figure 2b. SASA analysis provides insights into the potential of amino acids on the protein surface to interact with the solvent.
When the SASA results were evaluated, residues Asp202 and Glu271, which exhibited low mobility in the RMSF analysis, were found to have low SASA values. This finding confirms their location within the α-glucosidase's internal regions and hence they remain stable and inaccessible to the solvent. On the other hand, it is seen that Gly228 and Thr203, which are involved in substrate binding, exhibited high SASA and moderate-to-high RMSF values. In this context, it can be also said that high SASA values show that these amino acids are solvent-exposed and structurally positioned close to the surface. In this context, according to RMSF and SASA results, it can be considered that the related residues have an active role during substrate binding with their structurally dynamic characters.
Additionally, it is seen that the Pro218-Pro234 loop exhibited both high SASA and high RMSF values. This situation corroborates its role as a dynamic barrier to the active site. At this point, it is observed that the Leu227 and Gly228 residues with the highest mobility in the RMSF analysis in this loop, also exhibited significantly high SASA values. This suggests that they play a flexible role on the surface and interact dynamically both with the solvent and substrate. Shen et al. reported the importance of flexibility in regulating substrate accessibility and specificity in active site loops (long loop).20 Here, it can be said that our findings are consistent with this literature report, and our results emphasize the dynamic adaptability of the Pro218-Pro234 loop in facilitating substrate interactions under physiological conditions.
In conclusion, it can be inferred that the combined SASA and RMSF analyses provide a comprehensive understanding of the structural dynamics of the α-glucosidase enzyme. At this point, it can be also said that these findings indicate the balance between stable and flexible regions within the protein and it thereby emphasize their respective contributions to enzymatic function.
Following the RMSF and SASA analyses, the positions of key amino acids identified above as significant were visualized within the α-glucosidase enzyme structure to better understand their locations. The spatial distribution of these residues in the protein is depicted in Figure 3.
Secondary Structure Stability: DSSP Analysis
The results from RMSD, Rg, RMSF, and SASA analyses revealed the α-glucosidase's overall structural changes, flexibility, and solvent accessibility during the simulation. However, to fully understand the dynamics of the protein structure, it is necessary to examine the stability of its secondary structure elements throughout the simulation. For this purpose, a DSSP (Dictionary of Secondary Structure of Proteins) analysis was performed to evaluate the preservation or alteration of secondary structures, such as alpha-helices (α-helixes) and beta-sheets (β-sheets), over time. The secondary structure transitions of each amino acid in the α-glucosidase enzyme during the simulations are shown in Figure 4.
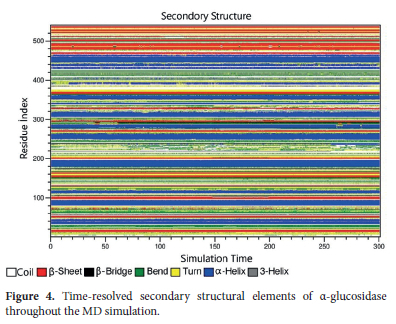
When examining the DSSP results, it was observed that α-glucosidase has predominantly α-helixes and β-sheets structures. This situation indicates that most of the protein comprises well-ordered secondary structures. In other words, these organized elements suggest that the protein has a stable core structure. According to the figure, throughout the simulation, α-helixes and β-sheet regions were largely preserved and this demonstrates that the major secondary structure elements remained stable and hence, the whole structural integrity of the protein was maintained. In contrast, turns and coil regions were observed intermittently in certain areas. This proffers that these structures are more flexible and disordered, in other words, these regions are likely located on the surface or in flexible regions of the protein. It can be also said that occasional short-term transitions in turn and coil structures during the simulation suggest that these dynamic structural regions underwent transient conformational changes. In this regard, it was also observed that amino acids with high mobility observed in the RMSF analysis (e.g., the Pro218-Pro234 loop and Leu227) were located in coil or turn structures. These flexible structures play an important role in protein dynamics and may regulate substrate entry and exit at the active site. Therefore, observing Pro218-Pro234 loop in coil or turn regions approves its dynamic role throughout the simulation. Moreover, the DSSP analysis showed that the secondary structure elements in catalytic and binding regions remained stable. This finding is particularly relevant for residues such as Asp202 and Glu271, which exhibited low RMSF values and are expected to remain stable. Their presence within stable secondary structure elements may be essential for enzymatic function.
In addition, by comparing the average proportions of secondary structures observed during the simulation with α-glucosidase's native state, it is possible to assess the extent to which the protein structure was preserved during the simulation (Table 1).
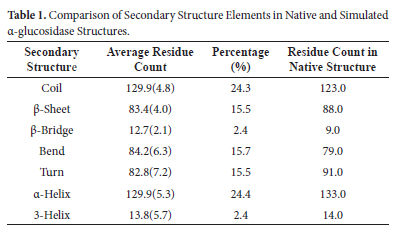
According to Table 1, during the simulation, coil structures are for an average of 129.9 residues, which is corresponding 24.3% of the total structure, whereas in the native state, the number of residues in coil conformation was 123.0. This suggests a slight increase in coil regions during the simulation and indicates that these regions gained flexibility over time. For β-sheet structures, an average of 83.4 residues (15.5%) were observed during the simulation while it was 88.0 in the native state. This small decrease may suggest that some β-sheets partially transitioned to coil or turn conformations during the simulation. However, the β-sheets were largely preserved in general. On the other hand, beta-bridge (β-bridge) structures were represented by 12.7 residues (2.4%) during the simulation, while the native state had 9.0 residues. This slight increase in β-bridge structures during the simulation could indicate that some regions temporarily adopted β-bridge conformations or underwent flexible adaptation in these areas. Bend structures were observed with 84.4 residues (15.7%) during the simulation while it was 79 in the native state. This small increase indicates that some regions, especially on the surface of the protein, undergo transient structural changes and gain flexibility during simulation. On the other hand, turn structures were observed with an average of 82.8 residues (15.5%) during the simulation, whereas this number was 91.0 in the native state. The slight decrease in turn structures may indicate that certain regions underwent secondary structural changes. Here, it may be also inferred that some turn structures transitioned into more flexible coil conformations. Examining α-helix structures, the α-glucosidase during simulation has an average of 129.9 residues (24.4%) while it has 133.0 residue in the native state. This result shows that α-helical structures were largely preserved during the simulation and remained structurally stable. Here, the slight decrease can be attributed that the transition of a few α-helixes into flexible coil conformations may have allowed minor adaptations without affecting the α-glucosidase's functionality. Examining three-helix structures in α-glucosidase, it was observed with 13.8 residues (2.4%) during the simulation, while the native state had 14.0 residues. This case indicates that three-helix structures were also largely preserved during the simulation. In summary, these results demonstrate that the general secondary structure characteristics of the α-glucosidase enzyme during the simulation remained largely consistent with its native state. Minor differences observed in surface and flexible regions suggest temporary adaptations occurring in these areas over time. However, the results indicate that these adaptations took place in a manner that did not compromise the overall structural stability of the protein.
Conformational Preferences: Ramachandran Plot Analysis
The data obtained from the DSSP analysis revealed the stability of the α-glucosidase's secondary structural elements and its ability to maintain structural integrity throughout the simulation. Following these structural insights about α-glucosidase, a Ramachandran plot analysis was performed to examine the conformational stability and adaptability of the protein in detail.
The Ramachandran plot analyzes the torsion angles phi (φ) and psi (ψ) of amino acids in the protein structure and thus it allows us to assess whether residues occupy permissible or preferred conformational sites. In this way, it enables possible us to determine the conformational preferences of different secondary structure elements. in a Ramachandran plot, for α-helices, the φ angles are typically observed between -60°and -40°, while ψ angles range from -50° to -30°. On the other hand, for β-sheets, the φ angles are generally within the range of -120° to -90° while and ψ angles are between 90° and 135°. Accordingly, it can be said that these values for α-helices correspond to a distinct cluster in the lower-left quadrant of the plot whereas β-sheets ones form a prominent cluster in the upper-left quadrant of the plot. On the other hand, residues that deviate from these characteristic regions often correspond to irregular structures, such as loops or turns since they exhibit more diverse dihedral angles. In summary, it can be said that the clustering of these angles on the Ramachandran plot provides critical insights into the structural organization and stability of proteins and can be associated with DSSP findings.
In Figure 5, the φ and ψ angle distributions of the α-glucosidase enzyme's amino acids throughout the simulation are depicted using a density gradient. The regions with intense red and yellow coloration indicate that a significant portion of the protein chain remains stable in organized secondary structures, such as α-helixes and β-sheets. This suggests that the primary secondary structural elements of the protein reside in their natural conformational regions and exhibit stable behavior throughout the simulation.
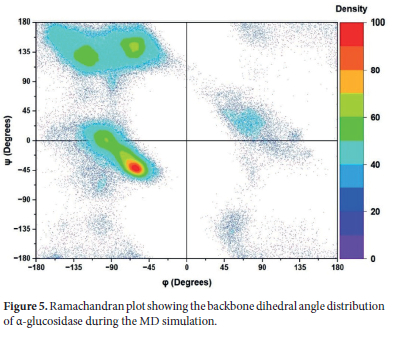
On the other hand, lower-density areas observed in blue and green correspond to less preferred and rarely observed conformations. Also, structures such as coils or turns, which allow greater conformational freedom, are expected to reside in these lower-density areas. In this respect, residues exhibiting high mobility according to the RMSF results (e.g., the Pro218-Pro234 loop) are expected to be located in these regions. When evaluated together with DSSP and other structural analyses, we can say that the Ramachandran plot analysis provides supportive insights into the conformational adaptability and stability of the protein throughout the simulation.
Residue-Residue Interaction Map: Contact Map Analysis
While the Ramachandran plot analysis demonstrated that the protein remained in allowed conformational regions and maintained its stability, the contact map (tertiary structure) analysis can enable a more detailed structural understanding to examine interactions between residues in the protein's three-dimensional structure. The tertiary structure provides significant insights into the three-dimensional organization of the α-glucosidase's secondary structural elements, i.e. the manner in which these structural elements are connected to form a stable configuration. In this context, the contact map analysis can allow us to evaluate pairs of residues that are in close contact within the α-glucosidase's three-dimensional arrangement and enable understanding of how structural stability is maintained.
The contact map shown in Figure 6 illustrates the probabilities of residue-residue interactions (P%) in the α-glucosidase's three-dimensional structure during the simulation. According to the contact map analysis, residues with high contact probabilities (red areas) are located in the core region of the protein and it can be said that these form tightly packed structures that ensure stability. These areas, as observed in the previous DSSP and Ramachandran plot analyses, predominantly consist of organized secondary structures such as α-helixes and β-sheets. On the other hand, it is observed those regions with low contact probabilities, (blue and green areas) correspond to flexible regions on the α-glucosidase's surface. These flexible regions were previously identified in the RMSF and SASA analyses as structures exhibiting high mobility and solvent accessibility. For example, regions such as Pro218-Pro234 loop, characterized by high mobility, were observed to have low contact density in the contact map. This indicates that flexible surface regions provide the dynamic structure necessary for substrates or ligands to bind and access the active site.
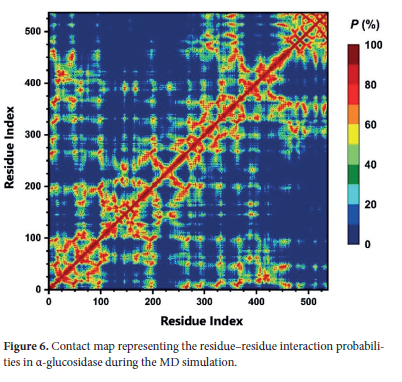
In conclusion, the contact map analysis clearly highlights the balance between stable core regions and flexible surface regions in the α-glucosidase's 3D structure. Therefore, it can be inferred that this three-dimensional organization enables the protein to maintain both structural integrity and functional flexibility.
Dominant Motions and Energy Landscapes: PCA and PEL Analyses
After obtaining insights into the structural balance from the contact map analysis, we then performed Principal Component Analysis (PCA) analysis. Here we aimed using by PCA to determine the α-glucosidase's most dynamic moving directions during the simulation and to investigate large-scale structural changes. It is well established that PCA utilizes the principal components (PC1 and PC2) that explain the greatest variance to identify the dominant motion motifs of the protein throughout the simulation.
In this regard, the evaluation of PCA, RMSD, and RMSF
analyses together can enable understanding of the nature of the conformational changes in the protein throughout the simulation. We observed that according to the previous RMSD analysis, the protein moved away from its reference structure and adapted to the simulation conditions, and in this context, we concluded that the enzyme stabilized around two main conformations. Furthermore, using RMSF, we obtained a plethora of insights into the regions of the protein that exhibited increased flexibility, thereby identifying residues that demonstrated elevated mobility throughout the simulation. At this point, the free energy landscape (FEL) obtained through PCA can further support these observations and detail the protein's two most favored conformational states during the simulation and the transitions between them. The energy minima observed in the FEL plots correspond to conformational states characterized by greater stability and compactness. In contrast, regions with higher energy correspond to more flexible or extended conformations of the enzyme. This relationship underscores the complementary role of FEL analysis in interpreting the structural dynamics of α-glucosidase.
The calculated PCA landscape was displayed in Figure 7. According to the figure, it is observed that there are two primary energy basins along the PC1 and PC2 axes. Here, it can be said that the smaller energy basin on the left corresponds to an alternative conformational state of the protein since it is at low free energy levels. This conformation can be considered as an intermediate structure that observed during the α-glucosidase's stabilization process, as suggested by the RMSD analysis.
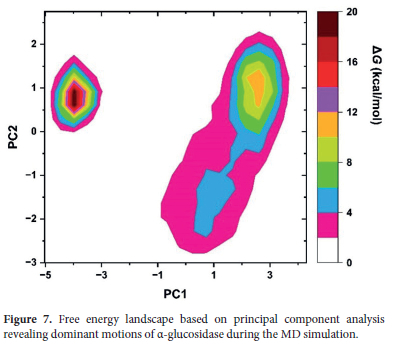
On the other hand, for the broader energy basin on the right, it can be stated that it corresponds with the glucosidase's main conformational state. According to the RMSD analysis, we previously concluded that the protein reached equilibrium around this primary conformational state during the later stages of the simulation and remained largely stable. Also, it can be, herein said that this broad energy basin indicates that while the protein is stable in this state, it also exhibits a certain degree of flexibility, allowing transitions to various sub-conformational states. These sub-conformations can be associated with the high-mobility regions identified in the RMSF analysis. For example, regions such as the Pro218-Pro234 loop, which displayed high flexibility in the RMSF analysis, transition between different sub-conformations within the broad energy basin, thereby enhancing the functional flexibility of the protein. We previously mentioned that these flexible regions are likely critical for accommodating substrate binding or other functional changes.
In summary, it can be inferred that the free energy landscape obtained from PCA is consistent with RMSD and RMSF data and accordingly, this indicates that the protein adopted two main conformational states during the simulation. Here, this comprehensive PCA output reveals that the α-glucosidase preserves the structural integrity necessary for its biological function while it also possesses sufficient mobility to respond to environmental stimuli.
The PCA analysis helped uncover the dominant motion directions of the protein and the energy basins surrounding these directions and this provide understanding the α-glucosidase's large-scale conformational changes. In addition to these analyses, another Free Energy Landscape (FEL) analysis was performed to further examine the α-glucosidase's three-dimensional structural changes and identify other stable states within the energy landscape. In this analysis, the Rg and End-to-End Distance (Re-e) were used as reaction coordinates. Here, with the selection of Rg and Re-e, we aimed at assessing the compactness of α-glucosidase and its macroscopic movements, such as opening and closing of the structure by measuring the distance between its two ends.
Accordingly, the free energy surfaces in Figure 8 shows the α-glucosidase's most referred conformational states and the energy differences between them along the Rg and Re-e axes.
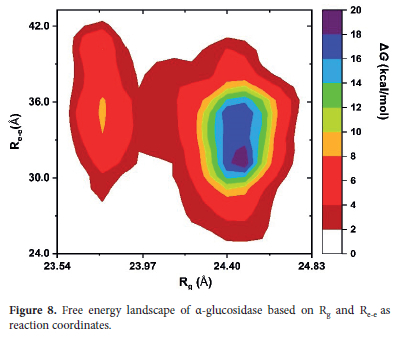
According to the FEL analysis, two main energy basins were observed as the α-glucosidase's preferred states during the simulation. The smaller energy basin on the left represents a more compact conformation, while the broader energy basin on the right represents a more extended conformation. Here, it can be said that these two energy basins indicate that the α-glucosidase transitions between compact and extended conformational states during the simulation. Here, it can be stated that these conformational clusters also offer different stability. Examining the low-energy compact structure on the left, it can be said that the α-glucosidase adopts a more folded state. In this regard, it is assumed that this compact structure is an indicator to maintaining stability and the resistance of environmental changes of protein.
On the other hand, the broader energy basin on the right represents corresponds to the -glucosidase's dominant and extended conformational state. Here, the blue and green-colored areas within this basin corresponds to the presence of more stable substructures in this dominant conformation and take place value range of Rg -23.025.5 and Re-e - 29.6-36.0. This situation suggests that, even in its extended state, the α-glucosidase retains certain stable conformations and transitions between different substructures. Thus, it can be stated that α-glucosidase also maintains flexibility throughout the simulation. The presence of these stable substructures within the extended conformation demonstrates that the α-glucosidase can both adapt its structure and preserve its functional integrity. In summary, these findings indicate the ability of the α-glucosidase to balance structural stability and flexibility. Therefore, it can be inferred that this ability enables it to function effectively in response to environmental stimuli or functional needs.
Overall, the results of these FEL analysis demonstrate that the protein exhibited a preference for two primary conformational states during the simulation, with energy barriers separating these states. The transitions between these states enhance the α-glucosidase's functional flexibility, enabling it to adapt structurally in response to environmental stimuli. The two stable states observed in the FEL analysis are consistent with the results of the PCA, RMSD, and RMSF analyses. In this context, it can be concluded that α-glucosidase possesses both a stable structure and the necessary flexibility to fulfil its biological function, and that these findings indicate the structural diversity and functional mobility required for this purpose
Molecular Interaction Forces: Hydrogen Bond and Salt Bridge Analyses
After examining the conformational dynamics and structural flexibility of the α-glucosidase via PCA and free energy surface analyses, hydrogen bond and salt bridge analyses were performed to evaluate the specific molecular interactions that ensure the structural integrity and stability of the α-glucosidase. As it is well established, these interactions are critical for the folding, stabilization, and adaptation of the protein to environmental factors.
In this regard, in the hydrogen bond analysis, the numerical changes and percentage distributions of hydrogen bonds formed between main chain-main chain (M-M), side chain-side chain (S-S), and main chain-side chain (M-S) throughout the simulation were computed and the obtained data are displayed Figure 9.
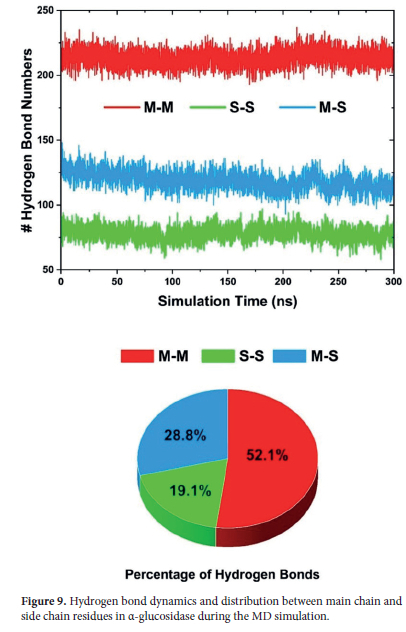
Accordingly, when examining the distribution of hydrogen bonds during the simulation, the largest contribution was observed to come from M-M bonds, which account for 52% of the total hydrogen bonds. It is well known that these bonds are mainly responsible for maintaining the structural stability of the protein and stabilizing the connections between secondary structures (especially α-helixes and β-sheets). On the other hand, S-S bonds contributed 19% and as is known, these bonds support stabilization by mediating interactions between side chains on the protein surface. Additionally, we observe that M-S bonds are for 29% and these bonds are known to contribute to protein folding and bridging different structural elements. Hence, these bond interactions enhance the stability of the three-dimensional structure.
Furthermore, For the observed small fluctuations in the number of hydrogen bonds over time, it can be said that conformational changes occasionally occur in the flexible regions of the protein and this situation lead the reorganization of hydrogen bonds.
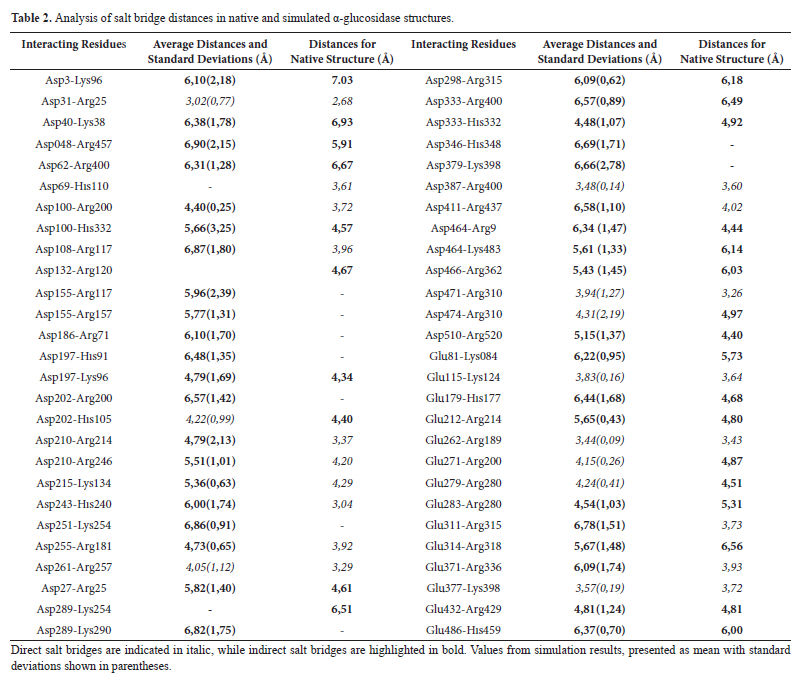
After hydrogen bond analyses, we carried out salt bridges analyses. Salt bridge interactions are a combination of hydrogen bond and electrostatic interactions established by between oppositely charged residues and therefore, they are significant to maintain the folded state and three-dimensional stability of proteins. In this context, the salt bridges in α-glucosidase were analyzed based on their average distances during the MD simulation and compared to their native structure ones. The salt bridge data are listed in Table 2.
At the table, interactions with distances shorter than 4 Å were classified as direct salt bridges, while those in the range of 4.3-7.0 Å were categorized as indirect salt bridges.26- 27 When residue pairs that formed direct salt bridges were examined throughout the simulation, it was understood that they can have a critical role in maintaining protein stability, particularly in core regions of α-glucosidase. For instance, Glu271-Arg200 and Asp155-Arg117 for the native structure are indirect salt bridge interactions with distances of 4.87 Å and 5.96 Å while they shift into direct salt bridge interaction class with average distances of 4.15 Å and 4.05 Å, respectively. These transitions indicate the stabilization of the α-glucosidase enzymes core structure, which is essential to preserve its functionality under dynamic conditions.
On the other hand, surface regions of the α-glucosidase displayed greater flexibility. At this point, some native salt bridges, such as Asp197-His91 and Glu486-His459, shifted from direct to indirect interaction class amongst the simulation and their interaction distances increased to 6.48 Å and 6.37 Å, respectively. Hence, this transformation can be associated with an increase in surface flexibility.
Moreover, we observed that new salt bridges, such as Asp100-Arg200 and Asp243-His240, were established during the simulation. Here, these interactions, absent in the native structure, are average distances of 4.40 Å and 6.00 Å, respectively and it can be said that they attributed the α-glucosidase's capacity to develop alternative stabilization mechanisms in response to dynamic conditions. On the other hand, we see that certain native salt bridges, including Asp155-Arg157 and Asp289-Lys254, were either weakened or completely vanished during the simulation. This behavior can be related with the structural adaptability of the protein, particularly in its surface regions.
Overall, the formations of new salt bridges and the weakening of some indicates the α-glucosidase's ability to reorganize its interactions in response to environmental stimuli. Also, these findings, consistent with RMSF, SASA, and PCA analyses, demonstrate that α-glucosidase combines structural stability and flexibility to fulfil its biological functions effectively.
CONCLUSION
This study provides a detailed examination of the structural stability and dynamic flexibility of the α-glucosidase enzyme using molecular dynamics (MD) simulations. The MD results identified the enzyme's stable core structure and flexible surface regions around the active site, which are essential for substrate binding and catalytic activity. Also, structural analyses such as RMSD, Rg, RMSF, and SASA demonstrate that the enzyme exhibits a flexible structural feature responsive to environmental conditions. Here, we observed that the flexible regions on the enzyme's surface can facilitate disaccharide binding and thus they can both enhance substrate specificity and support structural changes during substrate binding. On the other hand, it is seen that the stable core region preserves the enzyme's overall structural integrity and thereby can provide a supportive platform for catalytic activity. This balance along these structural dynamic features underscores the α-glucosidase's ability to perform biological functions with a stable yet adaptable architecture.
These findings suggest significant insights for developing α-glucosidase inhibitors. According to MD data, the structural properties of flexible regions overlapping with inhibitor-binding sites, can provide crucial information for designing effective inhibitors for diabetes treatment. Moreover, the detailed structural data obtained through MD simulations can contribute to the atomic-level analysis of complex biomolecules like α-glucosidase and guide to future biomolecular research and drug development efforts.
In conclusion, this study enhances our understanding of the structure-function relationship of the α-glucosidase enzyme and shed light on the balance between flexibility and stability required for its biological functionality. Simulation-based structural analyses can not only advance our understanding of biological functions but also provide significant information for discovering new therapeutic targets. Compared to previous MD studies on α-glucosidase in the literature, the present work stands out by identifying previously uncharacterized flexible loop regions around the active site through extended (300 ns) simulations. These insights reveal the enzyme's dynamic adaptability under near-physiological conditions and highlight new allosteric pockets that may serve as alternative drug-binding sites. Such detailed conformational knowledge represents a significant step forward in structure-based drug design, with potential to improve the specificity and efficacy of future α-glucosidase inhibitors.
ACKNOWLEDGEMENTS
The numerical calculations reported in this paper were partially performed at TÜBITAK ULAKBIM, High Performance and Grid Computing Center (TRUBA resources). The authors gratefully acknowledge TRUBA for providing computational support that contributed significantly to the MD simulations conducted in this study.
AUTHOR CONTRIBUTIONS
Şenol Topuz: Investigation, data curation, methodology, formal analysis, writing-original draft preparation and editing.
Kadir Demir: Writing-review and editing.
Hakan Alici: Investigation, data curation, methodology, formal analysis, writing-original draft preparation and editing, conceptualization, supervision, validation, writing-review and editing.
DECLARATION OF COMPETING OR FINANCIAL INTERESTS
The authors declare that they have no competing or financial interests related to this work.
ORCID IDS
Şenol Topuz: https://orcid.org/0009-0006-5131-4167
Kadir Demir: https://orcid.org/0000-0001-7312-3878
Hakan Alici: https://orcid.org/0000-0001-5105-8331
REFERENCES
1. Ernst HA, Lo Leggio L, Willemoës M, Leonard G, Blum P, Larsen S. Structure of the Sulfolobus solfataricus α-glucosidase: implications for domain conservation and substrate recognition in GH31. J Mol Biol. 2006;358(4):1106-1124. https://doi.org/10.1016/j.jmb.2006.02.056. [ Links ]
2. Chiba S. Molecular mechanism in α-glucosidase and glucoamylase. Biosci Biotechnol Biochem. 1997;61(8):1233-1239. https://doi.org/10.1271/bbb.61.1233. [ Links ]
3. Lombard V, Golaconda Ramulu H, Drula E, Coutinho PM, Henrissat B. The carbohydrate-active enzymes database (CAZy) in 2013. Nucleic Acids Res. 2014;42(D1):D490-D495. https://doi.org/10.1093/nar/gkt1178. [ Links ]
4. Samson SL, Garber AJ. Prevention of type 2 diabetes mellitus: potential of pharmacological agents. Baillieres Best Pract Res Clin Endocrinol Metab. 2016;30(3):357-371. https://doi.org/10.1016/j.beem.2016.06.005. [ Links ]
5. Azam SS, Uddin R, Wadood A. Structure and dynamics of alpha-glucosidase through molecular dynamics simulation studies. J Mol Liq. 2012;174:58-62. https://doi.org/10.1016/j.molliq.2012.07.003. [ Links ]
6. Bhatnagar A, Mishra A. Α-glucosidase inhibitors for diabetes/blood sugar regulation. In: Maheshwari VL, Patil RH, editors. Natural Products as Enzyme Inhibitors: An Industrial Perspective. Singapore: Springer Nature Singapore; 2022. p. 269-283. https://doi.org/10.1007/978-981-19-0932-0_12. [ Links ]
7. Chen H. Glycogen storage disease, type 2. In: Chen H, editor. Atlas of Genetic Diagnosis and Counseling. New York (NY): Springer New York; 2017. p. 1249-1259. https://doi.org/10.1007/978-1-4939-2401-1_108. [ Links ]
8. Parenti G, Andria G. Pompe disease: From new views on pathophysiology to innovative therapeutic strategies. Curr Pharm Biotechnol. 2011;12(6):902-915. http://dx.doi.org/10.2174/138920111795542606. [ Links ]
9. George KA, Anding AL, van der Flier A, Tomassy GS, Berger KI, Zhang TY, Sardi SP. Pompe disease: unmet needs and emerging therapies. Mol Genet Metab. 2024;143(3):108590. https://doi.org/10.1016/j.ymgme.2024.108590. [ Links ]
10. Özen H. Glycogen storage diseases: New perspectives. World J Gastroenterol. 2007;13(17):2541-2553. https://doi.org/10.3748/wjg.v13.i18.2541. [ Links ]
11. van der Ploeg AT, Reuser AJJ. Pompe's disease. Lancet. 2008;372(9646):1342-1353. https://doi.org/10.1016/S0140-6736(08)61555-X. [ Links ]
12. Karplus M, Kuriyan J. Molecular dynamics and protein function. Proc Natl Acad Sci USA. 2005;102(19):6679-6685. https://doi.org/10.1073/pnas.0408930102. [ Links ]
13. Hollingsworth SA, Dror RO. Molecular dynamics simulation for all. Neuron. 2018;99(6):1129-1143. https://doi.org/10.1016/j.neuron.2018.08.011. [ Links ]
14. Gelpi J, Hospital A, Goñi R, Orozco M. Molecular dynamics simulations: Advances and applications. Adv Appl Bioinform Chem. 2015;2015(8):37-47. https://doi.org.10.2147/AABC.S70333. [ Links ]
15. Papaleo E, Tiberti M, Invernizzi G. Molecular dynamics simulations to study structure-function relationship in psychrophilic enzymes. In: Rampelotto PH, editor. Biotechnology of Extremophiles: Advances and Challenges. Cham: Springer International Publishing; 2016. p. 675-698. https://doi.org/10.1007/978-3-319-13521-2_24. [ Links ]
16. Alici H, Tahtaci H, Demir K. Design and various in silico studies of the novel curcumin derivatives as potential candidates against COVID-19-associated main enzymes. Comput Biol Chem. 2022;98:107657. https://doi.org/10.1016/j.compbiolchem.2022.107657. [ Links ]
17. Lemay-St-Denis C, Doucet N, Pelletier JN. Integrating dynamics into enzyme engineering. Protein Eng Des Sel. 2022;35:gzac015. https://doi.org/10.1093/protein/gzac015. [ Links ]
18. Klepeis JL, Lindorff-Larsen K, Dror RO, Shaw DE. Long-timescale molecular dynamics simulations of protein structure and function. Curr Opin Struct Biol. 2009;19(2):120-127. https://doi.org/10.1016/j.sbi.2009.03.004. [ Links ]
19. Adelusi TI, Oyedele A-QK, Boyenle ID, Ogunlana AT, Adeyemi RO, Ukachi CD, Idris MO, Olaoba OT, Adedotun IO, Kolawole OE, et al. Molecular modeling in drug discovery. Inform Med Unlocked. 2022;29:100880. https://doi.org/10.1016/j.imu.2022.100880. [ Links ]
20. Shen X, Saburi W, Gai Z, Kato K, Ojima-Kato T, Yu J, Komoda K, Kido Y, Matsui H, Mori H, et al. Structural analysis of the α-glucosidase HAG provides new insights into substrate specificity and catalytic mechanism. Acta Crystallogr D Biol Crystallogr. 2015;71(6):1382-1391. https://doi.org/10.1107/S139900471500721X. [ Links ]
21. UniProt C. UniProt: The universal protein knowledgebase. 2024. https://doi.org/10.1093/nar/gky092. [ Links ]
22. Biovia DS. Discovery Studio Modeling Environment. San Diego (CA): Dassault Systèmes; 2017. [ Links ]
23. Pronk S, Páll S, Schulz R, Larsson P, Bjelkmar P, Apostolov R, Shirts MR, Smith JC, Kasson PM, van der Spoel D, et al. GROMACS 4.5: a high-throughput and highly parallel open-source molecular simulation toolkit. Bioinformatics. 2013;29(7):845-854. https://doi.org/10.1093/bioinformatics/btt055. [ Links ]
24. Huang J, Rauscher S, Nawrocki G, Ran T, Feig M, de Groot BL, Grubmüller H, MacKerell AD Jr. CHARMM36m: an improved force field for folded and intrinsically disordered proteins. Nat Methods. 2017;14(1):71-73. https://doi.org/10.1038/nmeth.4067. [ Links ]
25. Jorgensen WL, Chandrasekhar J, Madura JD, Impey RW, Klein ML. Comparison of simple potential functions for simulating liquid water. J Chem Phys. 1983;79(2):926-935. https://doi.org/10.1063/1.445869. [ Links ]
26. Darden T, York D, Pedersen L. Particle mesh Ewald: an N-log(N) method for Ewald sums in large systems. J Chem Phys. 1993;98(12):10089-10092. https://doi.org.10.1063/1.464397. [ Links ]
27. Essmann U, Perera L, Berkowitz ML, Darden T, Lee H, Pedersen LG. A smooth particle mesh Ewald method. J Chem Phys. 1995;103(19):8577-8593. https://doi.org.10.1063/1.470117. [ Links ]
28. Bussi G, Donadio D, Parrinello M. Canonical sampling through velocity rescaling. J Chem Phys. 2007;126(1):014101. https://doi.org/10.1063/1.2408420. [ Links ]
29. Parrinello M, Rahman A. Polymorphic transitions in single crystals: A new molecular dynamics method. J Appl Phys. 1981;52(12):7182-7190. https://doi.org/10.1063/1.328693. [ Links ]
30. Swope WC, Andersen HC, Berens PH, Wilson KR. A computer simulation method for the calculation of equilibrium constants for the formation of physical clusters of molecules: application to small water clusters. J Chem Phys. 1982;76(1):637-649. https://doi.org/10.1063/1.442716. [ Links ]
Received 25 March 2025
Revised 28 June 2025
Accepted 19 July 2025
* To whom correspondence should be addressed Email: hakanalici@beun.edu.tr
