


Services on Demand
Journal

Article
 English (pdf)
 Article in xml format
 Article references
 Send this article by e-mail
Indicators
Related links
-
 Cited by Google
 -
 Similars in Google
Share

 Permalink
Journal of Contemporary Management
On-line version ISSN 1815-7440
JCMAN vol.13 n.1 Meyerton 2016
RESEARCH ARTICLES
The suitability of South African risk-free rate proxies
Bs StrydomI; Ah CharterisII, *
ISchool of Accounting, Economics and Finance, University of KwaZulu-Natal strydomb@ukzn.ac.za
IIDevelopment Finance Centre, Graduate School of Business, University of Cape Town ailie.charteris@gsb.uct.ac.za
ABSTRACT
The aim of this study is to interrogate the suitability of the most common risk-free rate proxies used in South Africa compared to their American equivalents. The theoretical requirements for a risk-free asset are identified and the historical price of each proxy is tested to evaluate how they conform to each of these requirements using a variety of econometric approaches. While the American short-term rate closely satisfies the majority of the theoretical requirements, we find that the South African securities fail to meet these criteria with the South African Treasury bill rate in particular exhibiting greater variation and a volatility risk premium. The medium-term Treasury bond, currently favoured by practitioners, is thus found to be a more appropriate proxy for the risk-free asset in South Africa. These results challenge the current orthodoxy amongst academics and researchers in South Africa of using the short-term Treasury-bill rate.
Key phrases: Capital Asset Pricing Model; risk-free asset; risk-free rate; volatility risk
1. INTRODUCTION
Financial theory requires that expected future benefits accruing to a project be discounted at an appropriate required rate of return that adequately rewards investors for the risks associated with the investment. The most commonly used model for estimating investor's required rate of return is the Capital Asset Pricing Model (CAPM) (Graham & Harvey 2001:201; Sollis 2012:117).
In South Africa, the use of the model has increased considerably in recent years. Correia & Cramer (2008:41) established that 71% of firms surveyed used the model or a derivation thereof compared to the results of Pocock, Correia and Wormald (1991:36), in which only 35% of the respondents employed the CAPM. The 2015 Price Waterhouse-Coopers (PWC 2015:43) survey of financial analysts and corporate financiers also highlights the importance of the CAPM with all respondents indicating that they either always or frequently employ the model as the method to calculate the cost of equity.
The CAPM parameters (beta, the risk-free rate and the expected market return) are all theoretical constructs not directly observable in the market, and consequently proxies are used for these variables in practice (Firer 1993:25). The accuracy of the CAPM in determining the cost of equity is therefore, at least partly, a function of the proxies used and the difficulty in selecting these surrogates has hampered the implementation of the model (Correia & Uliana 2004:66). Firer (1993:37), in discussing the choice of proxy for the risk-free asset stated that "...CAPM users have not been given any firm and theoretically sound guidelines on which to base their estimates".
Twenty years later the situation is not greatly improved. Nel (2011:5345), in a survey of the application of the CAPM in South Africa, found significant divergence between theory and practice leading him to conclude that "... the most concerning discrepancy between academia and investment practitioners is perhaps the use of an appropriate Rf [risk-free rate] in the CAPM".
This study seeks to address this problem by interrogating the suitability of short-term versus long-term instruments as proxies for the risk-free asset in South Africa. To achieve this we first identify from the literature the theoretical requirements that an asset must closely satisfy to be considered a suitable proxy for the risk-free rate and then empirically evaluate the extent to which the short-term and long-term proxies adhere to these requirements compared to their US equivalents.
2. THE CHOICE OF RISK-FREE RATE PROXY IN THEORY AND PRACTICE
Government securities are typically used as proxies for the risk-free rate (Duarte & Rosa 2015:40; Kagraoka & Moussa 2014:29). Brigham and Ehrhardt (2014:195), differentiate between a short-term risk-free rate, proxied by the Treasury bill (T-Bill) rate, and a long-term risk-free rate, proxied by the (Treasury bond) T-Bond rate, but they clearly indicate that the short-term T-Bill rate is the appropriate proxy for the real risk-free rate (Brigham and Ehrhardt 2014:192).
While historically three-month T-Bills have been favoured (Fisher 2013:68; Harrington 1987:149), T-Bonds have become increasingly popular as evidenced in the findings of a survey by Bruner, Eades, Harris & Higgins (1998:19) in the US, in which 77% and 80% of the corporations and financial advisors surveyed favoured the use of securities with maturities greater than three years for the risk-free proxy. Fisher (2013:68) confirms the trend towards the use of long-term government bonds as the measure of the risk-free rate.
Following the US practice, South African finance textbooks typically advocate the use of short-term T-Bills as the appropriate proxy for the risk-free asset (see for example Firer, Ross, Westerfeld and Jordan 2012:452 and Gitman, Beaumont Smith, Hall, Lowies, Marx, Strydom & Van Der Merwe 2015:240). Kotzé (2010:239), however, indicates that all long-term government bonds can be considered relatively risk-free and recommend using the R157 bond, which at the time had a maturity of five years. Correia, Flynn & Uliana (2015:7-22) appear to be sympathetic to the use of longer-term bonds, but fail to provide students with an unambiguous answer as to which proxy to use.
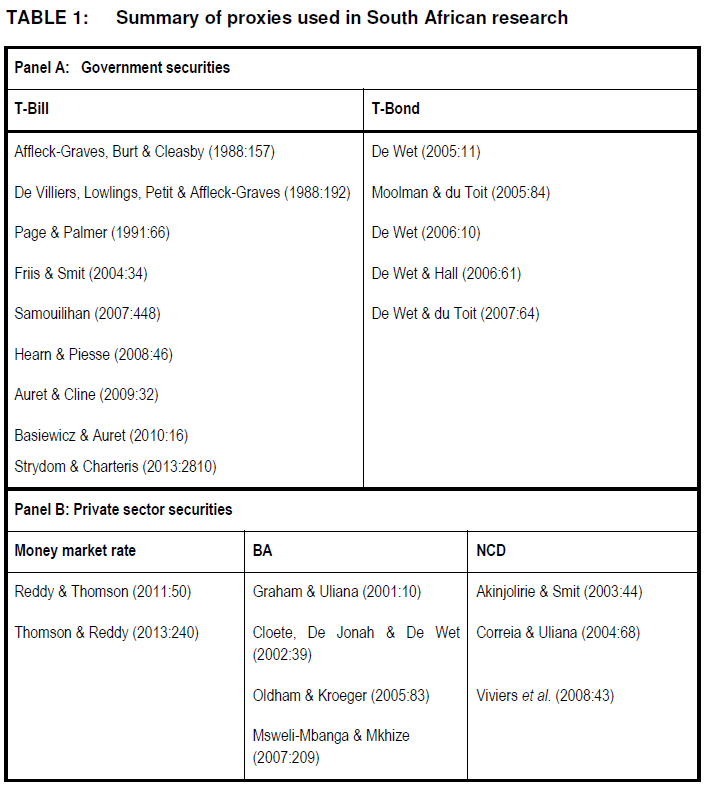
As detailed in Table 1, South African scholars have employed a wide variety of instruments as their proxy for the risk-free rate, although overwhelmingly they have opted for short-term proxies including the three-month T-Bill rate, the rate on Banker's Acceptances (BA), the money market yield and the three-month Negotiable Certificate of Deposit (NCD) rate. It is striking that, contrary to theory, many have chosen to employ private-sector instruments reflecting concerns some authors have expressed with using a rate set in a market where the government exercises such control over supply (Correia & Uliana 2004:66; Viviers, Bosch, Smit & Buijs 2008:43).
The 2015 PWC (2015:44-45) survey, in contrast, finds that practitioners employ long-term bonds in estimating the risk-free rate with the R186 government bond, which matures in 2026, being the most popular choice. The PWC (2015:44-45) survey also notes an increased preference for the use of a 10-year government bond yield derived from the yield curve.
As Nel (2011:5345) observed, a major disconnect thus exists between what is taught in South African universities and what is implemented in practice when it comes to the choice of risk-free rate proxy and yet the incorrect choice of proxy directly affects the validity of estimates obtained using the CAPM (Brown & Reilly 2012:229).
3. THEORETICAL CRITERIA FOR THE CORRECT SPECIFICATION OF THE RISK-FREE RATE
By definition a riskless asset should be devoid of risk, however, given the wide range of risks securities are exposed to, this requirement has a number of implications.
■ A pure interest rate
For a security to be classified as a risk-free instrument the return on the security must be equal to the pure interest rate (Brigham & Ehrhardt 2014:196; Sharpe 1964:431). Reilly & Brown (2012:15) expound on this, suggesting that the real return should only depend on the time preference of individuals for the consumption of income and the investment opportunities available in the economy. This implies that the return earned should not be influenced by external factors, such as government policies or economic events (Fisher 2013:71; Harrington 1987:153; Van Heerden 2016:571).
■ Variance in returns
For an asset to be risk-free in an uncertain environment the variance of the asset's returns must equal zero for the duration of the investment implying that the actual returns earned over the period always equal the expected return (Damodaran 2008:3; Fisher 2013:67; Sharpe 1964:431).
■ Interest rate risk
Interest rate risk comprises both reinvestment and price risk (Bodie, Kane & Marcus 2011:557), which are a function of volatility in interest rates. The yield on the risk-free rate proxy should not include compensation for the risk of interest rates fluctuating unfavourably during the life of the security. However, if the returns of the proxy instrument vary significantly over time, then the possibility exists that the return may include a premium for interest rate risk.
■ Inflation risk
Investors require a return which includes an inflation premium to provide compensation for the expected change in price levels over the investment horizon (Bekaert & Wang 2011:758). A risk-free asset should thus provide a yield greater than the real minimum return to compensate the holder for inflation (Firer 1993:28); that is, the return should comprise the pure interest rate plus a premium for inflation.
However, a risk-free security must still satisfy the criterion that it is free of inflation risk, which arises when actual inflation differs from expectations and the premium included in the yield on the security does not accurately reflect the observed price level changes during the period of the investment (Blake 2000:86). Consequently, for an asset to be free of this risk the expectations of inflation and the actual inflation level must be consistent.
It is well-documented in the literature that T-Bills minimise the impact of changes in price levels (Campbell, Shiller & Viceira 2013:61). T-Bill yields are reset weekly (at auction) such that any new expectations regarding the inflation rate are impounded into the new yield. In contrast, for T-Bonds the interest rate is fixed for the duration of the investment and if inflation increases, the price of the bond will fall until it matches the yield on current bonds issued in the current environment ... until it matches the yield on new bond issues in the market (Campbell et al. 2013:61).
This drop in the price of the bond results in negative returns for the long-term investor. Accordingly, yields on T-Bonds include a greater inflation risk premium to compensate investors for the possibility that the promised return may be eroded by unexpected changes in purchasing power (Pike & Neale 2006:250) providing support for the use of a short-term proxy.
■ Covariance with the market
A riskless asset, whose returns are always equal to the expected return, will have zero variation around its mean and thus it cannot be related to the movement of a risky asset's returns around its mean value (Reilly & Brown 2012:232). Hence the covariance of a risk-free security with any risky instrument, including the market portfolio consisting of all risky assets, must be zero (Charteris & Strydom 2011:51; Sharpe 1964:431).
■ Default risk
The security employed as the proxy for the risk-free rate must be devoid of default risk meaning that there is no possibility that the issuer of the security will default on the repayment of the investment to the holder (Damodaran 2001:3; Fisher 2013:67). Government securities are therefore identified as suitable proxies as a government can, under most circumstances, print money or raise taxes to avoid default on its commitments (Bodie et al. 2011:197; Damodaran 2001:4).
There is very little consensus in the literature as to whether short- or long-term securities have greater exposure to default risk. The view that the shorter the maturity, the safer the investment, is based on the perception that there is greater uncertainty as to whether a government will be able to meet its commitments in ten years as opposed to in three months as a consequence of business cycles, government policies and various other uncertain factors (Pike & Neale 2006:250; Fisher 2013:67). In contrast, Johnson (1967:323-328) developed the maturity crisis hypothesis that default premiums may be higher for debt of a short-term nature if investors believe that the borrower's inability to satisfy its obligations may be resolved in the future. However, these opposing views are difficult to test empirically which compounds the lack of consensus as to whether short- or long-term securities are likely to include a greater default risk premium.
■ Liquidity risk
Liquidity refers to the ease with which an asset can be sold without a significant reduction in value; liquidity risk thus arises from the difficulty in selling an asset in the secondary market with respect to both the time taken to sell the security and the price to be received (Reilly & Brown 2012:22). The risk-free rate in the CAPM should only provide investors with compensation for the temporary illiquidity of being without their funds for a single investment horizon (Firer 1993:28), and thus as a consequence of the fact that a risk-free asset must not exhibit any liquidity risk, no liquidity premium should be included in the yield (Brigham & Ehrhardt 2014:195).
4. DATA AND METHODOLOGY
In order for a proxy to correctly specify the riskless rate in the CAPM, it must closely satisfy all of the above conditions. In order to investigate the extent to which risk-free proxies commonly used in South Africa conform to the theoretical requirements, individual tests of each requirement were conducted; the details of which are outlined in the following sections. 1992 was selected as the starting point of the study as it captures the beginning of South Africa's greater exposure to global international markets post the apartheid isolation, and data was collected until the end of June 2013.
In order to conduct the analysis, it was necessary to be able to compare a short-run and long-run measure of the risk-free rate. Following the literature, for the short-term proxy, the three-month T-Bill was used. For the longer-term proxy however, the choice was less apparent. The studies of Correia & Cramer (2008:42) and PWC (2010:28) revealed the R157 (maturity in 2015) as the favoured choice amongst practitioners, although more recently in the 2012 (2012:34) and 2015 surveys (PWC 2015:44) the R186 (maturity in 2026) bond had become the most popular instrument. This change in preference reflects the near-maturity of the R157 bond (Kotzé 2010:239).
The R186, however, was issued in May 1998 and thus does not cover the entire period of this study. In the US, the longer-term risk-free rate is traditionally measured using the yield on a ten-year zero-coupon government bond index. The advantage of using this series as a proxy is that the yield always reflects the yield on a bond with a maturity of ten-years. A similar South African bond index does exist and it appears as though the use of this measure is increasing, as documented by PWC (2015:45). Accordingly, the yield on this ten-year bond index was used as the as the measure of long-term government bond. Monthly South African yield data was collected from the South African Reserve Bank (SARB) for the three-month T-Bill and the ten-year government bond.
In order to further examine whether the suitability of South African proxies is related to the nature of the South African market, the equivalent US proxies were also tested to provide a comparable reference point for analysing the performance of the South African proxies. US three-month T-Bill and ten-year T-Bond yields were obtained from the Federal Reserve for the same period.
5. RESULTS AND ANALYSIS
5.1 Variance in returns
To assess whether T-Bills and T-Bonds in South Africa and the US adhere to the requirement of zero variation over the investment horizon, an analysis of historical fluctuations in the returns of these instruments was performed. To compute the returns on the Treasury instruments, the prices of the assets were first calculated using the monthly yield data. T-Bills are priced as discount securities, as shown in equation 1. The South African and US T-Bonds are constant maturity zero coupon indices and were thus priced according to the formula shown in equation 2.
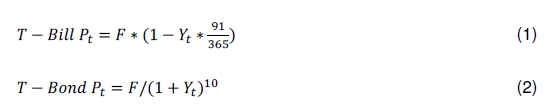
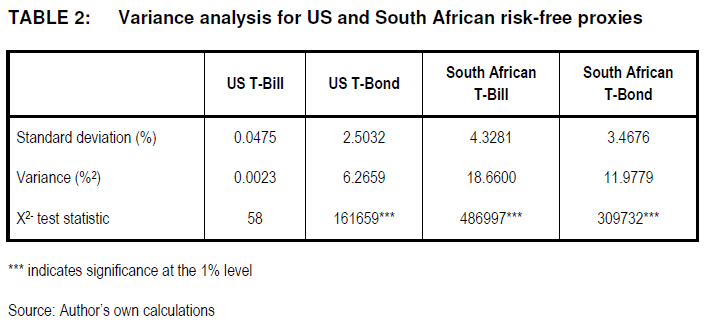
where: Pt is the closing price of the security, F is the face value of the instrument and Yt is the stated yield on day t (Bodie, Kane & Marcus 2002:30; Botha 2006:240). The compounded returns on the securities were then computed as the difference in the natural log of the price of the assets across each month. The variance of these returns is depicted in Table 2.
A test of the significance of the variance was conducted so as to assess whether these series conform to the requirement of zero variance. Usually a one-tailed chi-squared (X2) test is used to test the variance of a sample against a hypothesised value (see Keller & Warrack 2000:370-372). The problem with implementing this test, however, is that the hypothesised value is zero meaning that the statistic computed would be undefined. Accordingly, a hypothesised variance of 0.01 (standard deviation of 0.1%) was used.
The results in Table 2 reveal that the US short-term security exhibits, in contrast, the lowest variation in returns over time and this variation is not significant. The South African short-term security in contrast exhibits the greatest variation of the four securities and it is significant. US T-Bills thus satisfy the condition of zero variance and can be applied as the proxy for the risk-free rate in the CAPM without introducing significant risk caused by variability in interest rates. South African T-Bills in contrast, do not fulfil this requirement. Both long-term T-Bond securities exhibit significant variation over time, although again, the South African instrument still exhibits greater variation than its US counterpart.
It is interesting that with the South African securities, it is the short-term instrument that is more volatile than the longer-term instrument - the opposite from what is evident with the US securities. Several US textbooks have proposed the use of T-Bonds as proxies for the risk-free rate because of their lower variation (Brigham & Ehrhardt 2014:195; Harrington 1987:150) but the findings of this study do not support this recommendation.
5.2 Interest rate risk
The preceding discussion has highlighted the volatility of the returns of T-Bills and T-Bonds and thus it is important to determine whether a premium is included in the returns of T-Bills and T-Bonds for interest rate risk. The Generalised Autoregressive Conditional Heteroscedasticity in Mean (GARCH-M) model was employed for this purpose. The GARCH-M model expands the conditional mean equation of the GARCH model to include a lagged term of the conditional standard deviation (Brooks 2014:409-410). By including this term it is possible to determine whether the returns on the particular security are influenced by the volatility in the returns; hence the coefficient on the conditional standard deviation represents a volatility risk premium.
It is widely observed across financial literature that a GARCH (1,1) specification is sufficient to model the variability observed in the data (Bollerslev, Chou & Kroner 1992:2969) such that the conditional variance in the current period is modelled as a weighted average of the long-run variance, the new information in each period and the variance observed in previous periods. This order was applied for the examination of T-Bills and T-Bonds. The conditional mean and variance equations estimated as follows:
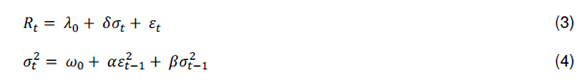
where: Rc are the returns of the asset in period t, σt is the square root of the conditional variance  in period t and εt is the residual in period t (Brooks 2014:410). The appropriate distribution for each series was selected using the Schwarz information criteria, with the t-distribution found to be optimal for all series.
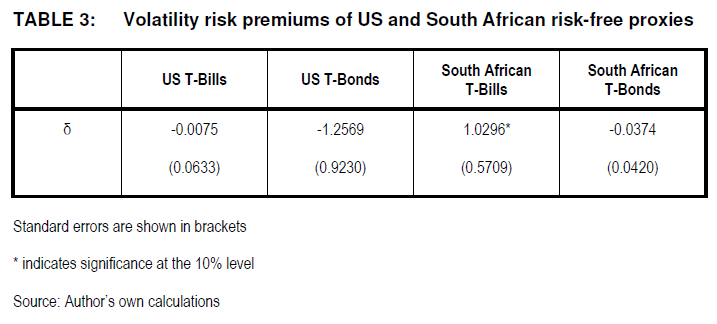
The estimates of the volatility risk premiums are shown in Table 3. For US T-Bills, the risk premium is insignificant and thus this proxy not only conforms to the requirement of zero variance over the investment period, but also does not provide compensation to investors for any variation in returns that may be experienced. In contrast, for South African T-Bills, the risk premium is significant; thereby indicating that the returns offered on this instrument include a premium to compensate investors for the volatility risk inherent in South African T-Bills. For the US and South African T-Bonds, an insignificant estimate for the risk premium is obtained, providing evidence that although these instruments do exhibit fluctuations in returns over time, no compensation for this volatility is provided to investors.
The inclusion of a volatility premium in the returns of South African T-Bills supports the higher volatility associated with this instrument identified in the preceding section. However, despite the high variance associated with long-term South African government securities, this security does not include a volatility risk premium. If investors purchasing T-Bonds have a long-term investment horizon, then short-term fluctuations in returns are not likely to have an impact on their wealth position and as such these investors may not demand compensation for the volatility in returns. Although the wealth position of short-term investors in T-Bills is guaranteed once the security is purchased, their ability to reinvest in the following period at the same rate depends on the movement in interest rates. In a volatile market these investors are thus exposed to volatility risk for which they require a risk premium which contradicts the theoretical requirements of a risk-free asset.
5.3 Inflation risk
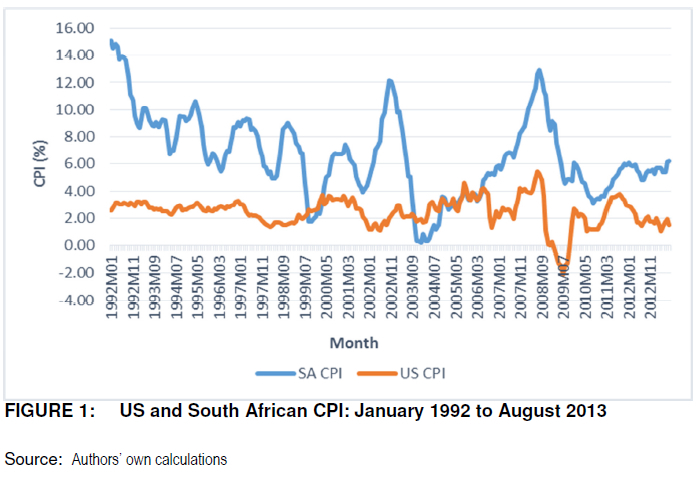
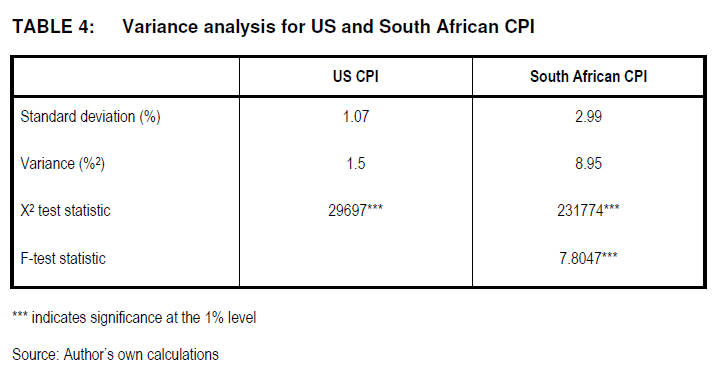
A comparison of the Consumer Price Index (CPI) for South Africa and the US was conducted for the period January 1992 to June 2013 based on monthly data from the SARB and Bureau of Labour Statistics respectively. Figure 1 shows a graphical comparison of the two series, which suggests that inflation in South Africa is substantially more volatile than in the US. The variance of the two series was computed, as shown in Table 4, and this confirms the much greater variation in inflation in South Africa with a standard deviation of approximately 3% over the horizon compared to only 1% for the US. The variance of the CPI series was tested to determine if they were significantly different from zero using the same approach as applied previously. The test statistics, shown in Table 4, reveal that for both the US and South African CP I, the variance estimates differ significantly from zero.
Given the notably higher variance in inflation associated with the South African CPI compared to the US CPI, an F-test of the equality of the variances of the two series was also performed (see Keller & Warrack 2000:429) and the test statistic of 7.8047 is significant at the 1% level (as shown in Table 4). This indicates that the variance in the South African inflation series is significantly higher than that associated with the US CPI. It therefore follows that while inflation risk is present for investors in the US, a finding consistent with the observation of Duarte & Rosa (2015:40), South African T-Bills and T-Bonds are exposed to greater inflation risk, thereby reducing their suitability to act as a risk-free rate proxy.
5.4 Covariance
The covariance of the risk-free asset with the market portfolio should be zero. For the purposes of this analysis, the Standard and Poor's 500 (S&P 500) Index and the FTSE/JSE J203 All Share Index (ALSI) were used to represent the US and South African markets respectively. Rather than testing the significance of the covariance estimates however, the correlation between the risk-free and market portfolio surrogates was used because of the difficulty in determining the distribution for the covariance measurement (Freund & Perles 2003:455-457). The Z-test statistic computed for this purpose is as follows:

where: r indicates the correlation coefficient estimate (Freund & Perles 2003:456).
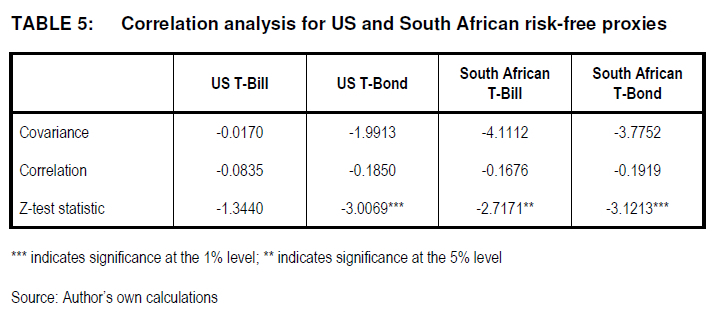
The results, presented in Table 5, indicate that the correlation of US T-Bills with the market is much lower than that of the other three securities and, in contrast to the other three instruments, is not significant. Interestingly, the South African T-Bond correlation with the ALSI is similar in magnitude and direction to the US long-term instrument, whereas with the short-term T-Bill, the South African security diverges from its US counterpart with a significant correlation estimate. Thus this analysis confirms the suitability of the US T-Bill as a proxy for the risk-free rate in terms of closely satisfying the requirement of zero co-movement with the market, whereas the long-term T-Bond does not satisfy this criterion. For South Africa, neither of the two securities met this criterion, with the difference between the two instruments relatively small.
5.5 Default risk
Theoretically, a risk-free asset should be free of default risk. Generally it is assumed that an asset backed by the government meets this requirement {Damodaran 2001:3), but there is some evidence that not even US T-Bills are entirely devoid of default risk (Damodaran 2008:3; Duarte & Rosa 2015:40; Nippani, Liu & Schulman 2001:258; Zivney & Marcus 1989:479). Well-publicised recent defaults of governments such as Greece, Ireland and Portugal, highlight that governments are capable of defaulting on debt, even local borrowing, and as a result in emerging markets a sizable default risk premium frequently exists.
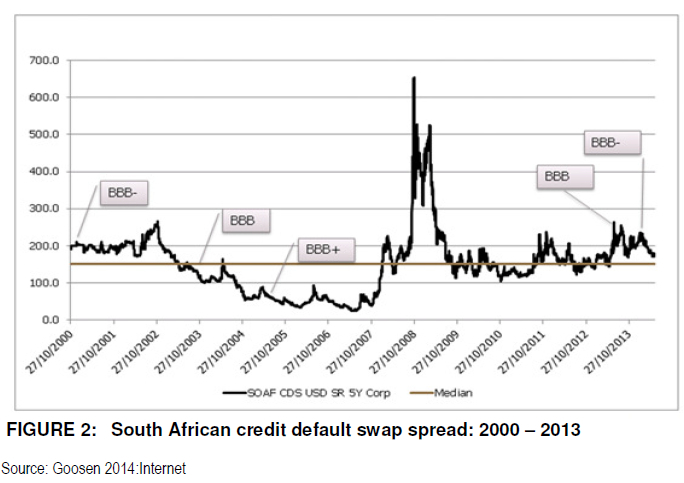
A sovereign default risk premium is usually computed as the spread in the yields between a long-term local bond and a US dollar-denominated bond (Damodaran 2008:24). An alternative measure thereof is the sovereign credit default swap (CDS) spread, where the spread captures the payment required to provide insurance against the default of the underlying country (Tang & Yan 2008:7).
Several studies (such as Houweling & Vorst 2005:1220; Hull, Predescu & White 2004:2799; Zhu 2006:221) have confirmed that these two measures of the sovereign default spread are approximately equal and are driven by the same default risk (Badaoui, Cathcart & El-Jahel 2013:2401). Moreover, Hull et al. (2004:2780) and Zhu (2006:223) conclude that the CDS spread is likely to lead the bond yield differential in price discovery as the CDS market responds to new information more rapidly than the bond market.
The five-year South Africa CDS spread for the period 2000 to 2013 is shown in Figure 2, with the South African foreign currency credit rating on long-term debt (as per S&P) also shown. This graph reveals that a substantial default risk premium is associated with South African securities, with the median CDS spread approximately 170 basis points over the period. It is also evident from Figure 2 that there is substantial volatility associated with this spread - for example, it reached a low of approximately 25 basis points at the beginning of 2007, and a high of more than 600 basis points less than two years later with the onset of the financial crisis.
If the South African investment environment is inherently riskier than a market such as the US then the inclusion of an appropriate risk premium in the minimum required rate of return for South African investments is arguably appropriate, as confirmed by Damodaran (2008:24). However, the fluctuations in the premium are problematic as they imply that the appropriate return on investments in South Africa is subject to change. Less reliance can therefore be placed on CAPM valuations based on a proxy subject to such fluctuations.
5.6 Liquidity risk
US treasury securities are, in general, highly liquid instruments because of their perceived risk-free nature and are thus easily bought and sold in the secondary market at close to their true values (Fleming 2003:83; Gürkaynak, Sack & Wright 2007:2291). Short-term South African government securities are considered to be reasonably liquid instruments, but longer-term T-Bonds have only become liquid in the past few years, as the domestic bond market has expanded; however, it is now considered to be one of the most liquid emerging bond markets in the world (Botha 2006:303). Thus, with respect to liquidity risk, South African securities on average do not appear to deviate substantially from the theoretical requirement.
The issue with respect to liquidity risk therefore is whether or not longer-term securities include a larger liquidity risk premium than short-term securities. The liquidity preference hypothesis holds that investors require a premium to induce them to invest in long-term bonds (Reilly & Brown 2012:637). This theory is supported by the fact that most yield curves are upward sloping (Fama 1984:539; Markese 1998:1).
Amira (2004:809) demonstrates empirically, using sovereign Eurobonds, that longer maturity fixed-rate bonds display greater price volatility and that as a result there is a positive relationship between maturity and yield spread. More recently, Gürkaynak et al. (2007:2300) synthesised the US yield curve over the period 1961 to 2006 and confirmed a greater liquidity premium associated with longer-term securities. Interestingly, they also observed lower yields for medium-term bonds compared to short-term bonds. It is thus plausible that longer-term government bonds will include a liquidity risk premium in their yields in contravention of the requirements for a risk-free asset. Goyenko & Ukhov (2009:203) confirm the greater liquidity associated with short-term securities compared to long-term T-Bonds.
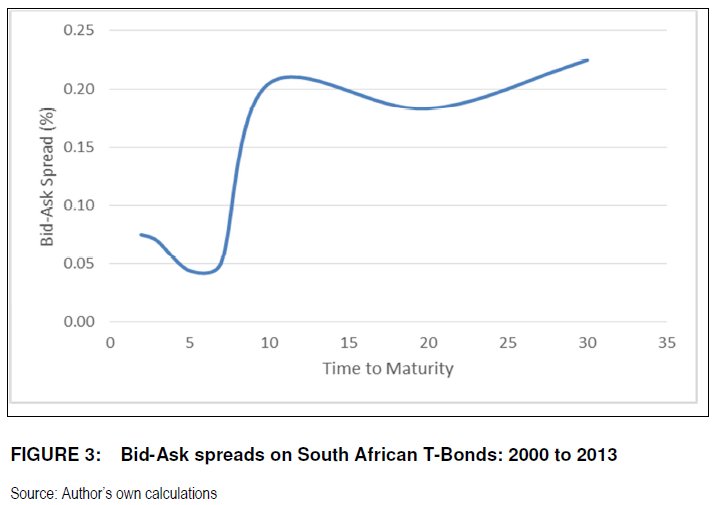
To corroborate these conclusions, the bid-ask spreads of South African T-Bonds over the period 2000 to 2013 were analysed, as suggested by Fleming (2003:99), as this provides an approximate measure of liquidity, as higher costs of trading reduce the volume of trading that occurs in the secondary market. Unfortunately, bid-ask data on T-Bills was not available; however, analysing these spreads for bonds of varying maturities (obtained from Bloomberg), as shown in Figure 3, does enable some conclusions to be drawn.
Firstly, this analysis confirms that longer-term bonds exhibit greater illiquidity (and are therefore likely to include a larger liquidity risk premium).
Secondly, the bid-ask spread is reasonably flat for longer-term securities signalling that the difference in liquidity of a 25-year compared to a 30-year bond is small.
Thirdly, the dip in the bid-ask spread for medium-term bonds (five to seven-year horizon) compared to shorter-term bonds with a two to three-year horizon) signals that investors prefer bonds of an intermediate horizon, which supports the survey evidence of PWC (2012:34) of the choice of practitioners of using bonds with five to seven year horizons as opposed to longer-term bonds. This greater liquidity of medium-term bonds compared to short-term bonds is consistent with the pattern of the yield curve derived for the US by Gurkaynak et al. (2007:2300).
6. COMMENT
This study sought to address the lack of clear guidance regarding the appropriate choice of risk-free rate proxy for investors wishing to utilise the CAPM in South Africa. A set of theoretical requirements that an asset must closely satisfy to be considered a suitable proxy were identified, with the South African and US short- and long-term proxies compared to these criteria.
The analysis revealed that the US T-Bill rate largely conforms to these theoretical requirements. In stark contrast the South African equivalent does not closely conform to the theoretical requirements of a risk-free asset, most notably with regard to significant variance, the inclusion of a volatility risk premium, greater inflation risk and significant movements with the market. This has major implications for the analysis of investments using the CAPM, as an inappropriate risk-free rate proxy can lead to errors in the allocation of scarce financial resources. Uncritically extending the American practice of using the short-term T-bill rate to the South African context is clearly inappropriate.
The results reveal that for several of the criteria, the South African T-Bond more closely adheres to the requirements than the T-Bill in so far as it exhibits lower variance and does not include a volatility risk premium. The effects of liquidity risk can be mitigated using a medium-term bond which appears to have the highest liquidity (as captured by the lowest bid-ask spread), which coincides with the choice of practitioners. The one shortcoming of the use of a longer term security is the inflation risk, where T-Bonds may include a greater inflation risk premium than T-Bills. However, the benefits of the T-Bill in terms of this single criteria are not sufficient to warrant its use.
7. CONCLUSIONS
In light of the results obtained, the conclusion of this study is that the South African T-Bill is not an appropriate measure of the risk-free rate, as advocated by many textbooks and used by numerous academics. Rather the evidence seems to suggest that practitioners appear to be using the more appropriate measure in the form of a medium-term T-Bond. These conclusions have important implications for the application of the CAPM to evaluate projects in South Africa.
However, this analysis has also revealed that the medium-term T-Bond has some limitations as a proxy for the risk-free rate in the South African market and accordingly, further research is still required to identify a more suitable measure, such as the returns on the minimum-variance zero-beta portfolio. It is also suggested that further research into the extent to which the choice of proxy affects the performance of the CAPM and alternative models such as Fama and French (1993:22) three-factor model is undertaken.
REFERENCES
AFFLECK-GRAVES J, BURT G & CLEASBY S. 1988. The premium on acquisition in South African mergers. South African Journal of Business Management 19(4):155-160. [ Links ]
AKINJOLIRIE A & SMIT E. 2003. South African unit trust performance and strategy in a changing climate (1989 - 2002). investment Analysts Journal 58:41 -50. [ Links ]
AMIRA K. 2004. Determinants of sovereign Eurobonds yield spread. Journal of Business Finance and Accounting 31 (5):795-821. [ Links ]
AURET C & CLINE R. 2011. Do the value, size and January effects exist on the JSE? Investment Analysts Journal. 74:29-37. [ Links ]
BADAOUI S, CATHCART L & EL-JAHEL L. 2013. Do sovereign credit default swaps represent a clean measure of sovereign default risk? A factor model approach. Journal of Banking and Finance 37:2392-2407. [ Links ]
BASIEWICZ Ρ & AURET C. 2010. Feasibility of the Fama and French three factor model in explaining returns on the JSE. Investment Analysts Journal 71: 13-25. [ Links ]
BEKAERT G & WANG X. 2010. Inflation risk and the inflation risk premium. Economic Policy 24(64):755-806. [ Links ]
BLAKE D. 2000. Financial market analysis, 2nd ed, Welwyn, Hertfordshire, UK: Wiley. [ Links ]
BODIEZ, KANE A & MARCUS Α. 2002. Investments. 5th ed. New York, NY: McGraw-Hill/lrwin. [ Links ]
BO DIE Z, KANE A & MARCUS A. 2011. Investments and portfolio management. 9th ed. New York, NY: McGraw-Hill/lrwin. [ Links ]
BOLLERSLEV T, CHOU Τ & KRONER K. 1992. ARCH modelling in finance: a review of the literature. Review of Econometrics 52:5-59. [ Links ]
BOTHA Z. 2006. The money market. In Van Zyl C, Botha Ζ & Skerrit Ρ (eds.) Understanding South African financial markets. 2nd ed. Pretoria: Van Schaik. pp. 229-283. [ Links ]
BRIGHAM E & EHRHARDT Μ. 2014, Financial management: theory and practice. 14th ed. Mason, OH: Thomson South-Western. [ Links ]
BROOKS C. 2014. Introductory econometrics for finance, 2nd ed, Cambridge, UK: Cambridge University Press, [ Links ]
BROWN K & REILLY F. 2012. Analysis of investments and management of portfolios. 10th ed. Boston, MA: South-Western Cengage Learning, [ Links ]
BRUNER R, EADES K, HARRIS R & HIGGINS R. 1998. Best practices in estimating the cost of capital: survey and synthesis. Financial Practice and Education 8:13-28. [ Links ]
CAMPBELL J, SHILLER R & VICEI RA L. 2013. Understanding inflation-linked bond markets. In Haliassos Μ (ed.) Financial innovation: too much or too little? Boston, MA: MIT press, pp. 29-70. [ Links ]
CHARTERIS A & STRYDOM B. 2011. An examination of the volatility of South African risk-free rate proxies: a component GARCH analysis. Studies in Economics and Econometrics 35(3): 49-64. [ Links ]
CLOETE G, DE JONAH Ρ & DE WET Τ. 2002. Combining Vasicek and robust estimators for forecasting systematic risk. Investment Analysts Journal 55(3):37-44. [ Links ]
CORREIA C & CRAMER P. 2008. An analysis of cost of capital, capital structure and capital budgeting practices: a survey of South African listed companies. Meditan: Research Journal of the School of Accounting Science 16(2):31-52. [ Links ]
CORREIA C, FLYNN D, ULIANA Ε & WORMALD Μ. 2015. Financial management. 8th ed. Cape Town: Juta. [ Links ]
CORREIA C & ULIANA Ε. 2004, Market segmentation and the cost of equity of companies listed on the Johannesburg Stock Exchange. South African Journal of Accounting Research 18(1):65-81. [ Links ]
DAMODARAN A. 2001. Estimating risk-free rates, New York, NY: Stern School of Business. [ Links ]
DAMODARAN Α. 2008. What is the risk-free rate? A search for the basic building block. New York, NY: Stern School of Business. [ Links ]
DE VILLIERS P, LOWLINGS A, PETTIT Τ & AFFLECK-GRAVES J. 1986. An investigation into the small firm effect on the JSE. South African Journal of Business Management 17(4):191-195. [ Links ]
DE WET J. 2005. EVA versus traditional accounting measures of performance as drivers of shareholders value -a comparative analysis. Meditan: Research Journal of the School of Accounting Sciences 13(2):1-16. [ Links ]
DE WET J. 2006, Determining the optimal capital structure: a practical contemporary approach, Meditari: Research Journal of the School of Accounting Sciences 14(2):1-16. [ Links ]
DE WET J & DU TOIT E. 2007, Return on equity: a popular, but flawed measure of corporate financial performance. South African Journal of Business Management 38(1):59-69. [ Links ]
DE WET J & HALL J. 2006, An analysis of strategic performance measures of companies listed on the JSE securities exchange. South African Journal of Economic and Management Sciences 9(1 ):57-71. [ Links ]
DUARTE F & ROSA C. 2015, The equity risk premium: a review of models, Federal Reserve Bank of New York (FRBNY). Economic policy review. December:39-57. [ Links ]
FAMAE. 1984. Term premiums in bond returns. Journal of Financial Economics 13:529-546. [ Links ]
FAMA Ε & FRENCH Κ. 1993. Common risk factors in the returns of stocks and bonds. Journal of Financial Economics 33:3-56. [ Links ]
FIRER C. 1993. Estimating the return parameters of the capital asset pricing model. South African Journal of Accounting Research (De Ratione) 7(1):23-39. [ Links ]
FIRER C, ROSS S, WESTERFELD R & JORDAN B. 2012. Fundamentals of corporate finance. 5th South African ed. Berkshire, MA: McGraw-Hill/lrwin. [ Links ]
FISHER P. 2013. Reflections on the meaning of "risk free" rates. In Bank of International Settlements (BIS). Sovereign risk: a world without risk free assets? 12:65-72. [ Links ]
FLEMING M. 2003, Measuring treasury market liquidity, Federal Reserve Bank of New York (FRBNY). Bank Review September 2003 pp. 83-108). [ Links ]
FREUND J & PERLES B. 2003, Statistics: a first course, 8th ed, Englewood Cliffs, NJ: Prentice-Hall, [ Links ]
FRIIS L & SMIT E. 2004. Are some fund managers better than others? Manager characteristics and fund performance. South African Journal of Business Management 35(3):31-40, [ Links ]
GITMAN L, BEAUMONT SMITH Μ, HALL J, LOWIES Β, MARX J, STRYDOM Β & VAN DER MERWE Α. 2015. Principles of managerial finance: global and South African perspectives. 2nd ed. Cape Town: Pearson Education. [ Links ]
GOOSEN E. 2014. Economic overview: September 2014. [Internet: http://blog.orafunds.co.za/post/Economic-overview-September-2014#.VGc2kpUcTIV; downloaded on 2015-05-03. [ Links ]]
GOYENKO R & UKHOV A. 2009. Stock and bond market liquidity: a long-run empirical analysis. Journal of Quantitative Analysis 44(1): 189-212. [ Links ]
GRAHAM J & HARVEY C. 2001. The theory and practice of corporate finance: evidence from the field. Journal of Financial Economics 60(1): 187-243. [ Links ]
GRAHAM M & ULIANA Ε. 2001. Evidence of a value-growth phenomenon on the Johannesburg Stock Exchange, Investment Analysts Journal 53(1):7-18. [ Links ]
GÜRKAYNAK R, SACK Β & WRIGHT J. 2007. The US treasury yield curve: 1961 to the present. Journal of Monetary Economics 54(8):2291-2304, [ Links ]
HARRINGTON D. 1987. Modern portfolio theory, the Capital Asset Pricing Model, and Arbitrage Pricing Theory: a user's guide. 2nd ed. Englewood Cliffs, NJ: Prentice-Hall. [ Links ]
HEARN B & PIESSE J. 2008. Pricing Southern African shares in the presence of illiquidity: a capital asset pricing model augmented by size and liquidity premiums. London, UK: Kings College London. [ Links ]
HOUWELING P & VORST T. 2005. Pricing default swaps: empirical evidence. Journal of International Money and Finance 24:1200-1225. [ Links ]
HULL J, PREDESCU Μ & WHITE A. 2004. The relationship between credit default swap spreads, bond yields and credit rating announcements. Journal of Banking and finance 28:2789-2811. [ Links ]
JOHNSON R. 1967. Term structure of corporate bond yields as a function of risk of default. Journal of Finance 22(2):313-351. [ Links ]
KAGRAOKA Y & MOUSSA Z. 2014. Estimation of the term structure of CDS-adjusted risk-free interest rates. Journal of Fixed Income 24(2): 29-44. [ Links ]
KELLER G & WARRACK B. 2000. Statistics for management and economics. 5th ed. Pacific-Grove, CA: Duxbury Thomson Learning. [ Links ]
KOTZÉ L. 2010. Bond valuation and interest rates. In Els G (ed). Corporate finance: a South African perspective. Cape Town: Oxford University Press. [ Links ]
MARKESE J. 1998. Treasury bond funds: a risky riskless investment? American Association of Individual Investors (AAII). [Internet: https://www.aaii.com/journal/article/treasury-bond4unds-a-risky-riskless-investment; downloaded on 2015-07-05. [ Links ]]
MOOLMAN Ε & DU TOIT C. 2005. An econometric model of the South African stock market. South African Journal of Economic and Management Sciences 8(1):77-91. [ Links ]
MSWELI-MBANGA Ρ & MKHIZE H. 2007. The risk-adjusted performance of companies with female directors: a South African case. South African Journal of Economic and Management Sciences 10(2):207-213. [ Links ]
NEL W. 2011. The application of the capital asset pricing model (CAPM): a South African perspective. African Journal of Business Management 5(13):5336-5347. [ Links ]
NIPPANI S, LIU Ρ & SCHULMAN C. 2001. Are treasury securities free of default? Journal of Financial and Quantitative Analysis 36(2):251-265. [ Links ]
OLDHAM G & KROEGER J. 2005. Performance, persistence and benchmarks of selected South African unit trusts for the period 1998-2002. South African Journal of Business Management 36(4):81 -90. [ Links ]
PAGE M & PALMER F. 1991, The relationship between excess returns, size and earnings to price ratio on the JSE. South African Journal of Business Management 22(3):63-72. [ Links ]
PIKE R & NEALE B. 2006. Corporate finance and investment. 5th ed. Essex, UK: Prentice-Hall. [ Links ]
POCOCK A, CORREIA C & WORMALD M. 1991. An analysis of the approaches used by industrial companies listed on the JSE to identify their cost of capital, South African Journal of Accounting Research (De Ratione) 5(1):27-40. [ Links ]
PRICEWATERHOUSECOOPERS, 2010. Signs of the times: valuation methodology survey 2009/2010. 5th ed. [Internet: https://www.pwc.co.za/en/assets/pdf/pwc-valuation-methodology-survey-2010.pdf; downloaded on 2014-03-25. [ Links ]]
PRICEWATERHOUSECOOPERS. 2012. An African Perspective: valuation methodology survey 2011/2012, 6th ed. [Internet: https://www.pwc.co.za/en/assets/pdf/valuation-methodology-survey-2012.pdf; downloaded on 2014-03-25. [ Links ]]
PRICEWATERHOUSECOOPERS. 2015. Africa: a closer look at value: valuation methodology survey 2014/2015. 7th ed. [Internet: http://www.pwc.co.za/en/assets/pdf/valuation-methodology-survey-2015.pdf; downloaded on 2016-04-21. [ Links ]]
PWC see PRICEWATERHOUSECOOPERS.
REDDY Τ & THOMSON R. 2011. The capital-asset pricing model: the case of South Africa. South African Actuarial Journal 11:43-84. [ Links ]
REILLY F & BROWN K. 2012. Investment analysis and portfolio management. 8th ed. Mason, OH: Thomson South-Western. [ Links ]
SAMOULIHAN N. 2007. The price of risk in the South African equity market. South African Journal of Economics 75(3):442-458. [ Links ]
SOLLIS R. 2012. Empirical finance for finance and banking. Cornwall, UK: Wiley. [ Links ]
SHARPE W. 1964. Capital asset prices: a theory of market equilibrium under conditions of Risk. Journal of Finance 19(3):425-442. [ Links ]
STRYDOM Β & CHARTERIS A. 2013. The South African risk-free rate anomaly. African Journal of Business Management 7(28):2807-2816. [ Links ]
TANG D & YAN H. 2008. Liquidity and credit default swap spreads. Athens: EFA (351h conference of the European Finance Association, 27-30 Aug. [ Links ])
THOMSON R & REDDY T. 2013. The capital-asset pricing model reconsidered: tests in real terms on a South African market portfolio comprising equities and bonds. South African Actuarial Journal 13:221-263, [ Links ]
VAN HEERDEN C. 2016. The eminence of risk-free rates in portfolio management: a South African perspective. Journal of Applied Business Research 32(2): 569-596. [ Links ]
VIVIERS S, BOSCH J, SMIT E & BUIJS A. 2008. The risk-adjusted performance of responsible investment funds in South Africa, Investment Analysts Journal 68:39-55. [ Links ]
ZHU H. 2006. An empirical comparison of credit spreads between the bond market and the credit default swap market. Journal of Financial Services Research 29:211-235. [ Links ]
ZIVNEY T & MARCUS R. 1989. The day the United States defaulted on Treasury bills. Financial Review 24(3):475-489. [ Links ]
* Corresponding author
