




Services on Demand
Journal

Article
 English (pdf)
 Article in xml format
 Article references
 Automatic translation
 Send this article by e-mail
Indicators
Related links
-
 Cited by Google
 -
 Similars in Google
Share

 Permalink
South African Journal of Industrial Engineering
On-line version ISSN 2224-7890
S. Afr. J. Ind. Eng. vol.36 n.4 Pretoria Dec. 2025
https://doi.org/10.7166/36-4-3267
GENERAL ARTICLES
Development of a Sustainable Inventory Management System for Maintenance Industry
M.R. MolokoaneI; O. MakindeII; K. RamdassI; I. DaniyanI, III, *; H.S. PhuluwaI
IDepartment of Industrial Engineering and Engineering Management, University of South Africa, Florida, South Africa
IIDepartment of Quality and Operations Management, University of Johannesburg, Johannesburg, South Africa
IIIDepartment of Mechatronics Engineering, Bells University Of Technology, Ota, Nigeria
ABSTRACT
Excessive inventory is harmful to any organisation, and typically adds to high inventory carrying costs, reducing employee efficiency, increasing equipment expenses, and causing a loss of opportunity. This study considers inventory management techniques for reducing and controlling excess inventory for manufacturing industries. It uses a case study approach to investigate the underlying causes of excess inventory, which were identified as design specification changes, wrong items being procured, bulk purchases, order changes by clients, intuitive buying, and spares not being traceable. This study's findings showed that purchases without a confirmed demand, a parked/staged fleet, changes in specification, spares take-on, and demand changes by clients account for 80% of the total excess stock, and so must be carefully reviewed. The results also show that organisations could salvage money from the excess stock if the right inventory technique were applied. The research recommends that management set up a clear demand policy that would require top management approval to procure inventory. The policy would incorporate 12-month time fences and zones to allow just-in-time delivery of inventory for immediate consumption; develop a lateral transhipment policy; and adopt a management toolkit to dispose of excess inventory. The outcome of this study could help organisations to gain an in-depth understanding of inventory stock keeping units (SKU) in order to reduce inventory holding costs.
OPSOMMING
Oormatige voorraad is skadelik vir enige organisasie en dra tipies by tot hoë voorraadkoste, wat werknemersdoeltreffendheid verminder, toerustinguitgawes verhoog en 'n verlies aan geleenthede veroorsaak. Hierdie studie oorweeg voorraadbestuurstegnieke vir die vermindering en beheer van oortollige voorraad vir vervaardigingsbedrywe. Dit gebruik 'n gevallestudie-benadering om die onderliggende oorsake van oortollige voorraad te ondersoek, wat geïdentifiseer is as veranderinge in ontwerpspesifikasies, verkeerde items wat verkry word, grootmaat-aankope, bestellingsveranderinge deur kliënte, intuïtiewe aankope en onderdele wat nie naspeurbaar is nie. Hierdie studie se bevindinge het getoon dat aankope sonder 'n bevestigde vraag, 'n geparkeerde/gefaseerde vloot, veranderinge in spesifikasies, onderdele-aanname en vraagveranderinge deur kliënte 80% van die totale oortollige voorraad uitmaak en dus noukeurig hersien moet word. Die resultate toon ook dat organisasies geld uit die oortollige voorraad kan red as die regte voorraadtegniek toegepas word. Die navorsing beveel aan dat bestuur 'n duidelike vraagbeleid opstel wat goedkeuring van topbestuur vereis om voorraad aan te skaf. Die beleid sal 12-maande tydheinings en sones insluit om net-betyds aflewering van voorraad vir onmiddellike verbruik moontlik te maak; 'n laterale oorlaaibeleid ontwikkel; en 'n bestuurshulpmiddelstel aanneem om oortollige voorraad te verkoop. Die uitkoms van hierdie studie kan organisasies help om 'n diepgaande begrip van voorraadhoudingseenhede (SKU) te verkry om voorraadhoudingskoste te verminder.
1. INTRODUCTION
Inventory can be classified as working capital in the form of goods. The inventory in railway industries such as Company X is mostly maintenance spare parts and raw materials, which cost money to have on hand. This is especially true in Company X, where the primary financial goal is to maximise value, and inventory management helps to achieve that goal. According to Penny et al. [1], inventory management encompasses all activities associated with creating and maintaining a level of inventory of raw materials, work-in-progress (WIP), and finished inventory such that enough materials are available, and the costs of overstocking or understocking are kept to a minimum. Sohail and Sheikh [2] emphasised that rigorous management is necessary for inventory because it is one of a company's most significant assets. Higher interest and storage expenses are incurred when inventory is retained at a high level; nonetheless, low levels of inventory cause frequent disruptions in the manufacturing schedule, which underuses capacity and lowers revenues. Inventory management's objective is to determine and preserve the best possible amount of investment in inventory that would help to attain the desired objective. A deeper knowledge of this is offered by the inventory management control of operational costs.
Company X specialises in preserving and repairing locomotives and manufacturing wagons, coaches, and other parts for rolling stock and related transportation equipment. It has been holding a combination of excess inventory, which is worth R1.3 billion, for a period of eight years [3]. The inventory held at the organisation are items that were not consumed in the twelve-month period of the fleet maintenance cycle, which then resulted in holding obsolete, excess, or slow-moving inventory. These inventories either tie up capital or cash since they have no demand, or they are obsolete. An excess of inventory is disruptive, causing storage problems for factories that are designed for lean, just-in-time manufacturing systems.
Company X responsibilities include ensuring the availability of locomotives and wagons for Freight Rail. However, owing to a high level of obsolete inventory, the firm is unable to ensure the availability of trains for the coal, iron ore, and manganese lines, since it is unable to borrow or buy spare parts to return damaged locomotives and wagons to operation in order to generate income [3]. The researcher's preliminary findings revealed that Company X had more than 300 parked locomotives as a result of a shortage of raw materials and spare parts to bring these locomotives into service, and that it had stock on hand (SOH) worth R2.6 billion that had been bought to maintain and manufacture rolling stock equipment [3]. Fifty per cent (50%) of the R 2.6 billion would not be consumed, as the stock items were either obsolete or incorrect spare parts for the current fleet that required maintenance [3]. This was evidence of inefficiencies in inventory management. Thus, it was necessary to develop a proper and sustainable inventory management system. In the light of this, the aim of this study was to develop such an inventory management system for Company X.
The objectives were to identify and classify excess inventories and their root causes at Company X, and to develop a sustainable inventory management system to mitigate the impact of excess inventory to aid management decisions, especially when they had a limited budget for procuring spare parts and raw materials.
• The following are some of the research questions that were formulated to address the research problem:
• What various categories of excess inventory are held at Company X?
• Which categories of excess inventory held at Company X are the "vital few"?
• What are the causes of holding excess/obsolete and non-obsolete inventory at Company X?
• Which methods and strategies should be deployed to generate value out of the excess/obsolete and non-obsolete inventory held at Company X?
Inventory decisions had to consider the reordering costs, inventory carrying costs, short-run costs of inadequate supply, and control system costs. It was simpler to categorise the expenses in two parts: a constant component that is independent of the size of the replenishment, and a variable component that includes the cost of materials. Carrying costs include the expense of borrowing the cash that has been held up or been unavailable for use in investment, warehouse operation costs, insurance, taxes, and obsolescence. Many businesses in today's economic climate are plagued by excess and obsolete inventory. Organisations with improper strategies for inventory management are more likely to suffer losses because of either high carrying costs or lost sales [5]. Thus, effective inventory management is critical to an organisation's profitability because it represents a significant investment in working capital [6], particularly for maintenance and manufacturing companies. However, effective inventory management remains a major problem for firms [7].
This study is significant in that it could provide an in-depth understanding of inventory stock keeping units (SKUs) and reduce the inventory holding costs at Company X. Proper inventory management would help organisations to maximise their profit potentials and also to reduce inventory deterioration because of the corrosion of steel items and the expiry of consumables inventory items such as rubber and paints. This study also adds to the understanding of the concept of inventory management, including its principles, strategies, and models. While numerous studies of inventory management have been undertaken, none have explicitly focused on the development of a sustainable inventory management system for Company X.
2. LITERATURE REVIEW
2.1. Overview of inventory management
Inventory is the stock kept by an organisation to meet future production requirements [6-7]. Srour and Azmy [8] stated that effective inventory management has a positive impact on return on asset and return on equity. Khan and Siddiqui [9] argued that an inventory is the stock of physical items kept at a certain storage location. Khalid and Lim [6] stated that it is a block of working capital maintained as raw materials. Khobragade et al. [10] maintained that an imbalance can offset the production schedule whereas, in the manufacturing cycle, efficient inventory management systems can reduce cost, waste, and time [11]. Mishra and Salunkhe [12] and Riza et al. [13] noted that inventory's primary function is to keep a business operating efficiently in an expectable environment at a minimum cost. Sarma [14] showed that keeping inventory serves the objective of separating the purchase and selling activities. According to Urissa [15], companies must keep inventory in warehouses in order to satisfy customer requirements. Sarma [14] showed that inventories are kept in excess of what is required for the production run in order to prevent supply constraints. Gurtu [16] maintained that keeping inventory helps a business to prevent variations in demand and supply from having an impact on sales or output. Muller [17] highlighted that inventories help to sustain continual production. Manufacturing companies maintain inventories to guide against unexpected changes in demand and supply and to improve the continuous flow of production by making certain that the vital components are available to allow for economical production runs [18]. Inventories help to accommodate variations in product demand, reducing the occurrence of stockouts and allowing goods to be distributed at a reduced cost. It provides for greater flexibility in the manufacturing schedule, and helps to decouple successive phases of operations so that when a problem, such as a machine breakdown or shortage of supplies, occurs in one department, the effect is not seen in the phases of operations that follow it. While the problems in the affected department are being resolved, other departments with appropriate inventory stock can continue to operate normally. Thus, inventories help to balance industrial processes, sustain employment, and so enhance employee relations by storing both human and machine contributions. It allows an organisation a hedge against unexpected pricing and delivery uncertainty from strikes, inflation, and price increases, thereby offering a way to achieve economic lot sizes and quantity savings. However, excessive inventory is harmful to any organisation, and typically adds to high inventory carrying costs, which decrease worker productivity, increase equipment expenses, and cause a loss of opportunity. According to Nnamdi [19], excess or surplus inventories are SKUs with substantial stock on hand compared with the average annual consumption. George [20] investigated whether inventory management had an influence on a company's net earnings, and discovered that firms with a shorter inventory conversion time or a higher inventory turnover ratio had higher net profits than those with a higher inventory conversion period or a lower inventory turnover ratio. A review by Negi and Kharde [21] identified the following factors that contribute to excess inventory: forecasting inaccuracy, leveraging on volume purchases, mistakes in data input, communication gaps, concerns about quality, obtaining the incorrect material, and an ineffective inventory management system. The cost of excess inventory during the year can range from 20% to 40% of the inventory value [21]. According to Nnamdi [19], excess and dead inventories are caused by a change in the original equipment maintenance strategy, the use of substitute spare parts, the entry of new spare parts, and transient or long-term changes in demand.
Before a product becomes obsolete or unsellable, it goes through several stages before it can no longer be sold. Typically, slow-moving inventory moves into excess inventory, then finally into obsolete inventory. An organisation with excess stock on hand faces a critical inventory management decision. It has a range of options for disposing of excess inventory: returning it to the supplier, selling it to a third party, or even scrapping it. However, when disposing of excess inventory, it is necessary to determine an optimal retention period (e.g., no disposal period), to determine an optimal disposal quantity, and to model how many items to dispose of simultaneously and when. Ngugi [22] argued that maintaining inventory at the lowest cost while still ensuring a supply for continuing operations is the main objective of inventory management. Inventory management systems minimise costs, maximise profits, and meet customer needs by ensuring that enough inventory is available at the right time and location, and of sufficient quantity and quality. In order to become more competitive, African manufacturing enterprises need to use sustainable inventory management systems. Ngugi [22] emphasised the importance of inventory management control in reducing an organisation's total operating costs.
It is worth noting that one of the most crucial assets that most organisations own is their inventory because of how critical its turnover is to generating revenue and, ultimately, profits for the company's stockholders. While a large inventory has traditionally been considered an advantage, with the development of innovative inventory management strategies, excessive inventory has been seen as counterproductive because of its high carrying costs. A study has suggested that the annual inventory holding costs should be kept between 20% and 40% of the total material costs [23]. Consequently, most companies explore various methods to reduce their inventories, such as consignment stock and vendor managed inventory (VMI). At Company X, excess inventory was around 50% of the total inventory.
The terms "excess", "surplus", and "obsolete inventory" are sometimes used interchangeably. Obsolete inventory is a product that has reached its end of useful lifecycle and that is not likely to sell in the future because it does not have value or demand. Obsolete inventory could be as a result of a series of events such as incorrect forecasting, an inappropriate inventory management system, poor goods or design quality, clumsy purchasing, and misleading lead times. If any of these are problems, businesses should closely examine their processes and take the necessary steps to fix them before they suffer financial loss. According to Nnamdi [19], excess and dead inventories could be attributed to changes in maintenance policies or changes in spare part use, the introduction of new spare parts, and temporary/permanent variations in demand. Nnamdi [19] recommends that excess, surplus, and dead inventory be disposed of, scrapped, or sold at a loss, and that organisations develop a policy for disposing of excess inventory [19].
A supply chain manager needs to take three steps to reduce excess inventory in a manufacturing facility: identify potential excess materials; review the items with value chain stakeholders to determine whether they are indeed excess; and dispose of the materials in a way that maximises revenue [19]. High levels of excess inventory can affect an organisation's profitability and long-term viability. The company has already spent money on these items and, in the case of manufacturers, time has already been invested - expenses that the company will not be able to recover. Furthermore, the longer that excess inventory is kept on hand, the more money it costs. Nnamdi [19] argued that using warehouse space to store a significant volume of inventory could only increase the organisation's costs if the inventry were not consumed within 12 months. Holding excess inventory also carries the risk of its becoming obsolete before it can be sold [24]. Pourhejazy [25] argued that, as you keep a product on hand for a longer period of time, its quality and value diminish; and so such a company must provide for that depreciation. Insurance charges increase as storage facilities and inventory values grow [25]. According to Sugiono and Alimbudiono [26], excess inventory has a direct impact on the newness or deterioration of goods, and on the high carrying cost of stock. The financial burden of maintaining excess inventory is created in the context of inventory carrying costs, and is primarily associated with the cost of dating, which is addressed in both physical and monetary terms [27].
2.2. Policies of inventory management
Inventory policies are critical in directing inventory decisions in order to achieve effective management of inventory in organisations. Inventory policies must be developed, implemented, and evaluated in order for businesses to manage inventory effectively and so ensure that customers are fulfilled. Chithraponnu and Umamaheswari [28] highlighted that decisions made about inventory management could affect an organisation's survival. According to Panigrahi [29], inventory control is the practice of maintaining a company's inventory levels in accordance with inventory policy, such as continuous and periodic reviews. Kurdhi and Doewes [30] discovered that an inventory policy is affected by the review period. Arismawati and Prastyabudi [31] suggested that an appropriate inventory policy would be based on the specifics of the technical process. Goltsos et al. [32] stressed the importance of inventory policies in providing a practical and guided approach to decision-making, such as about the quantities of items to reorder. Under a periodic review policy, the inventory level is reviewed once per period [30]. In the view of Rizkya et al. [33], a continual review policy is an inventory monitoring policy in which the ordering process is carried out when the inventory level has attained the reorder point. The same view was expressed by Kurdhi and Doewes [30]: that, under a continuous review policy, the inventory level is constantly monitored. This policy states that, when the inventory level attains the reorder point, a fixed quantity is ordered. This type of inventory management is shown in Figure 1, in which it is evident that demand is variable.
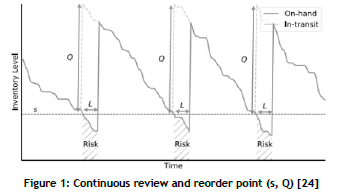
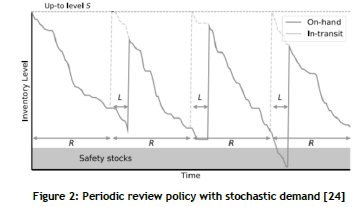
The focus of supply chain mangers should be to reduce the risk period (L) because that would reduce inventory levels and prevent the further accumulation of excess stock. In contrast, a periodic review shows that the inventory level is frequently monitored and that reorders are placed to increase the inventory level to a predetermined level [30].
Figure 2 shows a fixed-period policy. As may be observed, demand is stochastic.
Some inventory management policies include such elements as the ABC classification, economic order quantity (EOQ), EOQ with backordering, the quantity discount model (QDM), and multiple product EOQ.
2.2.1. ABC classification
The ABC classification method is based on the Pareto principle for assessing which items should be prioritised in inventory management. According to the Pareto principle, 20% of the items account for 80% of sales. May et al. [34] asserted that the ABC analysis groups inventory items into three categories, based on their importance: items in class A are the most valuable, class B items are relatively important, and class C items have less significance. Up to 80% of the revenue comes from as few as 20% of the items designated as class A. Class B items contribute the remaining 15% (from 80% to 95%) of revenue, while class C items account for the remaining 5% of revenue. In the light of this, control policies and methods can be described once categories and classes have been established [34].
Douissa and Jabeur [35] highlighted two methods that are used to accomplish the ABC classification of inventory items: ranking and classification. The ranking approach, or the ABC categorisation of SKUs, is achieved based on the item ranking. According to the classification method, inventory items are categorised, using the ABC system, based on similarities between the objects that need to be classified and the usual items that belong to each category [35]. Our understanding is that the present categorisation models use the first strategy to allocate inventory items to ABC groupings or classes. According to Douissa and Jabeur [35], ABC categorisation is carried out using three ranking-based methods: the mathematical programming (MP), meta-heuristics (MH), and multi-criteria decision-making (MCDM) techniques. The MP method suggests linear and non-linear organisational models to calculate each item's score; as an outcome, an array of weights is formed to maximise each item's performance, which is represented by a weighted score [35]. When there are a lot of inventory items, many optimisation models need to be solved, which is the fundamental drawback of MP classification model strategies. The MH techniques strongly advise using well-known meta-heuristics such as the genetic algorithm, particle swarm optimisation, and simulated annealing to calculate the criteria weights [36-37]. The item evaluation on the various criteria is then merged with these criteria weights, using more or less aggregation algorithms such as weighted sum to compute the weighted score for each item. The third group of methods, MCDM, propose a two-step methodology to categorise inventory items into ABC categories. The analytic hierarchy process (AHP) is used once in the first step to calculate the criteria weights, and an aggregation rule is used in the second step to determine the overall score for each inventory item [35].
2.2.2. Economic order quantity
In inventory management, EOQ is used to determine the optimal delivery size and to select the least expensive supplier, resulting in the least overall cost of investment in inventories. EOQ is defined in inventory management as the order quantity that reduces the lot size, ordering cost, volume of orders, annual cost, holding cost, order size, and amount of inventory.
The EOQ model uses the exchange between ordering cost and storage cost to determine the quantity to use in replenishing inventory. A bigger order lowers the frequency of orders, and so lowers the cost of placing orders, but it also requires keeping a larger average inventory, which raises the cost of retaining the inventory. On the other hand, a smaller order size decreases average inventory, but requires more frequent ordering and involves a greater ordering cost.
Equation 1 can be used to compute the EOQ model.

where D denotes demand per time unit, c denotes ordering cost, and Ch denotes carrying cost per unit.
2.2.3. EOQ with backordering (planned shortages with backorder)
The conventional inventory system made the implicit assumption that the customer would make a payment to the seller as soon as he received the goods. However, the seller typically grants the consumer a grace period to pay for the products in today's competitive market. The consumer can also use trade credit as a strategic instrument to increase the demand of his customers. Shajalal et al. [38] developed a model for predicting backorders that uses a deep neural network to mitigate lost sales and reduce merchandise backordering costs. Huang and Wu [39] showed that introducing backordering could minimise inventory costs for businesses. Li et al. [40] broadened their study's focus to include trade credit by taking acceptable payment delays into account as part of backordering EOQ studies. Mondal et al. [41] created a fuzzy EOQ model to account for the uncertainty of various costs and banking interests, incorporating the system of inventory control. One of the fundamental tenets of the EOQ methodology is that backordering and shortages are not permitted. Nevertheless, it is presumed that any demand that cannot be met owing to a shortage of inventory could be backordered and delivered to the customer at a later date.
2.2.4. Quantity discount model
The EOQ model determines how much to order by assuming that the cost per unit of ordered goods remains constant, irrespective of the number of units purchased. However, when order quantities are large, it is common for vendors to offer discounts. The EOQ may fluctuate when discounts are included in the calculation. The concept of quantity discount models has been substantially altered by the just-in-time production system, also known as the lean manufacturing system. These systems typically have substantially smaller orders. Khorasani and Almasifard [42] defined a quantity discount as the reduction in the unit cost of an item when purchased in large quantities. There may often be a trade-off between a reducted product cost and an increase in the holding cost because of excess inventory.
2.2.5. Multiple product EOQ
Traditional methods for calculating the EOQ in inventory management presuppose a predetermined demand for a single product, usually at a constant rate. Mubiru [43] developed an optimisation model to determine the EOQ that would reduce the inventory costs of multiple products under a periodic inventory monitoring programme with parametric uncertainties or stochastic demand. Maddah et al. [44] argued that enumeration could be used to identify the ideal substitution scenario in an EOQ setting, and suggested heuristic method to minimise the enumeration effort. Jonrinaldi et al. [45] suggested a multiple items EOQ model that takes discrete and continuous demand into account where a variety of delivery systems would be used to meet discrete demand. Eksler et al. [46] argued that a buyer would typically prefer to consume a product with comparable qualities or functionality when he learns that a desired product is not available, rather than making no purchase at all. Khalilpourazari et al. [47] suggested a multi-product EOQ model with imperfect products in supply deliveries. The usual incorrect assumptions in the standard EOQ model are that all purchased items are of excellent quality and that demand is constant. Nonetheless, in a real-world setting, some of the acquired goods could sustain damage as a result of carelessness or an accident during the shipping process, and the demand rate might change over time. As a result of this problem, many recent researchers have concentrated on the inventory model with defective quality products. Studies commonly assume that defective items are revoked or removed at the conclusion of the product cycle and subsequently sold at a reduced price [48].
3. METHODOLOGY
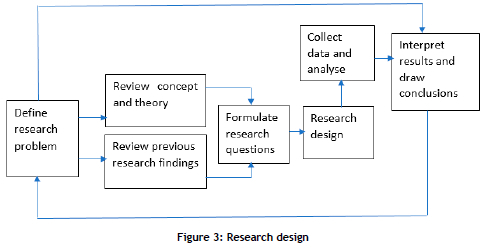
This study uses the quantitative research approach. The quantitative research methodology was chosen to analyse numerically the nature of the inventory management system currently used in Company X, to identify its pitfalls, and to come up with controls and strategies to improve this system. Figure 3 presents the procedure followed in conducting this study.
3.1. Case study
Company X deals with maintenance spare parts and raw materials, which cost money to have on hand. The primary financial goal of this company is to maximise value, and effective inventory management could help to achieve that goal. Company X specialises in preserving and repairing locomotives and in manufacturing wagons, coaches, and other parts for rolling stock and related transportation equipment. At the time of this study was conducted, it had held a combination of excess inventory, worth R1.3 billion, for eight years [3]. However, given a high level of obsolete inventory, the firm is unable to ensure the availability of trains for the coal, iron ore, and manganese lines, since it is unable to borrow or purchase spare parts to return damaged locomotives and wagons to operation in order to generate income [3]. The preliminary findings of the researcher were that Company X had more than 300 locomotives parked as a result of a shortage of raw materials and spare parts that made it unable to bring these locomotives into service; and that it had a stock on hand (SOH) of R2.6 billion that was bought to maintain and manufacture rolling stock equipment [3]. Fifty per cent (50%) of the R2.6 billion would not be used, as it was either obsolete or not the correct spare parts for the fleet that required maintenance [3]. This was evidence of inefficiencies in inventory management. Thus, it was necessary to develop a sustainable inventory management system to ensure proper inventory management. In the light of this, the aim of this study was to develop a sustainable inventory management system for Company X.
3.2. Data collection
Secondary data such as inventory reports, a material movement history, and inventory requirements reports obtained from Company X for the financial years from 2016/2017 to 2020/2021 were analysed to solve the research problem. The inventory report provided information about the material, valuation area (ValA), total stock, total value, and moving average price, and the standard price; these were analysed to identify the total inventory held at Company X.
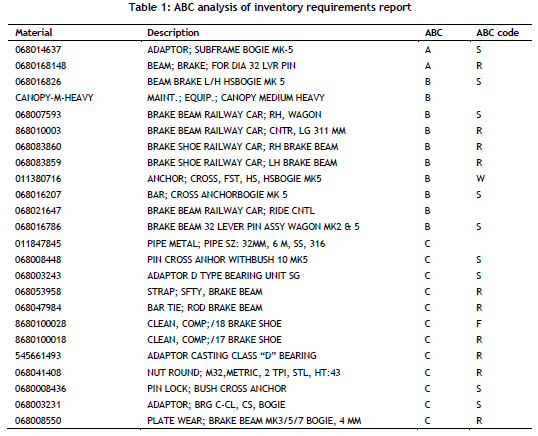
The material movement history listed all the material documents that had been posted, including the last date received and the date on which the material was issued to production, the purchase order, the vendor, and the storage location. The output data was used to determine the excess stock. All material not used within 365 days was considered excess stock. The details of the inventories that were ranked using ABC analysis and classified into ABC codes are shown in Table 1.
3.3. Data analysis
A descriptive statistical approach was used in this study, since it allowed for the data to be presented clearly and understandably. Kaur et al. [49] stated that descriptive statistics is typically the number one step statistical process undertaken during the quantitative process of data analysis. De Smith [50] observed that descriptive statistics define the primary characteristics of data collection.
The secondary quantitative data to be collected was analysed using descriptive statistics such as tables for data visualisation in Microsoft Excel and Pareto graphs. Charts and tables were presented so that they clearly illustrated a conclusive picture from statistical evidence that was derived from the data in order to emphasise the conclusion of the research.
3.4. Problem-solving methodology
An ABC analysis was carried out on the inventory report and the inventory requirements report to classify the various inventories held at Company X. Pareto analysis was used to determine the "vital few" inventories held at the company. The following steps were used to compute the ABC analysis:
• Gathering data. The output was the total inventory held at Company X. The inventory data included active and inactive materials per valuation area; total stock in quantities and unit prices per item (multiplied to obtain the total value per item; and the periods (the report consisted of the purchasing history of the material items).
• ABC classification.
• Grouping of items according to the reasons for procurement, using management reports, such as spares left over after a project had been completed, or items bought in anticipation of a demand that never materialised.
• Computation of cumulative percentages.
• Creation of Pareto curve.
A fishbone diagram was used to evaluate the root causes of holding excess inventory according to the researcher's evaluation of the inventories at company X. Many methods and strategies that could be used to convert the excess inventories held by the organisation to cash were identified and screened to determine the most suitable method to generate value out of the excess inventories. A suitable inventory management system, premised on the use of a relevant inventory management model that was available in the literature, was developed to ensure effective inventory management at company X.
4. RESULTS AND DISCUSSION
Figure 4 shows five-year inventory (closing stock on hand) data for Company X. The analysis is based on the active stock versus the Inactive stock. Active stock are items that show frequent movement in being issued to maintenance and production lines, and inactive or dead items are those that have not moved for a period of twelve months (365 days).
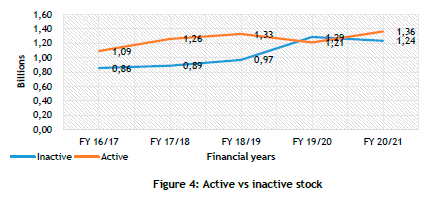
Figure 4 indicates that in the financial year 2016/2017 (FY 16/17), the value of Company X's total stock on hand was R1.95 billion and that 78.9% (R1.54 billion) was excess or inactive stock. The stock was held in various warehouses around the nine provinces. In the FY 17/18, the value of the total stock was R2.15 billion, of which R0.97 billion was classified as excess stock. The value of the total stock in the FY 18/19 was R2.3 billion, of which the excess stock was R0.97 billion. In FY 19/20 and FY 20/21, the total value was R2.5 billion and R2.6 billion respectively, of which the excess stock constituted R1.29 billion and R1.4 billion respectively. There was thus an upward trend in the value of the active and excess stock and of quantity in Company X for the five years in question.
A thorough investigation was conducted to understand a composition of the stock, and it was found that it did not grow excessively in quantity and but in value. This was because Company X used standard prices for finished or semi-finished material and moving average price for raw materials and external procurement. Although TE continued purchasing stock without confirmed demand, the main contribution to the high stock value was the moving average prices. The finding was that a lot of excess stock was as a result of items being left over after a programme had been completed.
4.1. Categories of excess inventories held at Company X.
The researcher compiled a list of the excess inventory items held at Company X, conducted a thorough investigation of each valuation area, and grouped the items according to the project or programme for which they were intended. Table 2 lists the items classified as excess stock and grouped by programme or project.
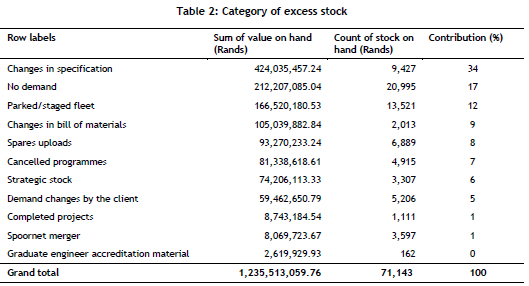
As may be noted from Table 2, the largest contributor to the total excess stock was a category called "Changes in specification" which contributed 34%. These were items that could not be consumed because the specification of the items changed in the middle of the production; as a result, Company X had to procure more materials to finish the production. The second-largest contributor, at 17%, was items procured by the management of Company X without a confirmed demand for them. These were bought in anticipation of a PRASA contract and other programmes that were in the pipeline. The third-largest contributor, at 13%, was items held in stock after the fleet of locomotives were discontinued by management because of its age and the difficulty of finding other spare parts. The fourth-largest category of items, at 9%, was identified as "Changes in specification"; these were excess owing to changes in bills of materials (BOM). Stock taken on from customers made up 8%; these were unplanned items that Company X bought from a customer, Company X Freight Rail, and sold back to the customer when the company received a locomotive for maintenance and repair. Items from cancelled programmes made up 7% of the excess; these were items procured for a programme, but during production the quantity was reduced or the programme was cancelled, leaving Company X with items it could not use. "Strategic stock" formed 6% of the excess; these were items held in stock that were no longer being produced or manufactured, and, to procure them, Company X had to develop a supplier to produce them. The remaining 6.39% of excess stock was made up of clients' demand changes, completed projects, the Spoornet merger, and graduate engineer accreditation material.
The Pareto principle method, often referred to as the 80-20 rule, was used in this study to identify the categories of the "vital few" inventories held at Company X. Biswas et al. [51] defined Pareto analysis as a technique for grouping items, events, or activities according to their perceived significance. The Pareto principle, according to O'Neill [52], is that 20% of a company's inventory represents 80% of the total value of inventory on hand. Table 3 indicates the inventory holding cost or carrying cost per category at Company X.
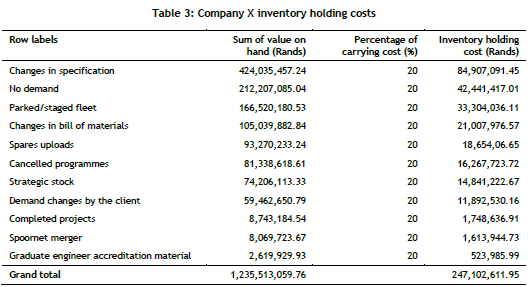
The total inventory carrying cost for Company X's excess stock was calculated to be R247.1 million. Typically, holding costs are computed as a percentage of the unit value, (about 20%) [53]. For the purpose of this study, 20% was used to calculate the inventory holding cost. The items categorised as "Changes in specification" were the highest, as they contributed 34% of the total holding costs. The holding costs were calculated using Pareto analysis.
Figure 5 shows the Pareto chart that identified the "vital few" excess stock categories. The Pareto chart in Chart 1 shows the accumulated percentage of excess stock and the total holding cost per category of excess stock. The "vital few" categories were those that constituted up to 80% of the problem, while the remaining categories were termed the "trivial many", and contributed 20%.
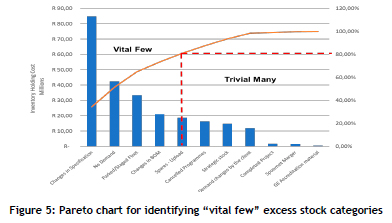
The five categories below accounted for 80% of the problems:
• Changes in specification
• No demand
• Parked/staged fleet
• Changes in BOM
• Spares uploads
Keep in mind that the line graph's slope starts to flatten out when the first five contributors (the "vital few") account for 81 per cent of the total. Except in cases where a straightforward solution was provided that would solve these categories collectively, the remaining contributors (the "trivial many") would not significantly reduce excess stock on an individual basis, and should be removed from the management focus of eliminating excess stock.
Now that the "vital few" categories of excess stock had been identified, there was a need to conduct a root cause analysis of the excess inventories to ascertain suitable practices that would ensure the use of a suitable inventory system at Company X.
4.2. Causes of holding excess/obsolete and non-obsolete inventory held at Company X
4.2.1. Root cause analysis
Inventory analysis is crucial because it enables managers to concentrate their efforts on their most important materials and to adjust their inventory control policies accordingly. In this study, a Pareto principle was applied to identify the "vital few" excess inventories for the purpose of devising an inventory control strategy that would focus effort where it would have the greatest effect in reducing excess inventory. The root cause analysis discovered significant issues about how Company X had amassed so much excess stock over the years. First, the warehouse team had a responsibility to safeguard the spare parts and always ensure stock accuracy. During the investigation, it was found that inventory records on the system did not match what was physically present in the warehouse. Figure 6 presents the root cause analysis for the potential causes leading to excess inventory.
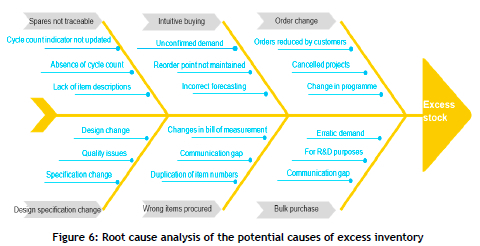
Second, it was evident that the current inventory management system and control at Company X was not effective. The analysis discovered that excess inventory worth R212 million was accumulated through intuitive buying: it was procured without being linked to any demand, or procured in anticipation of an order in the pipeline. The management overlooked the inventory management processes and approved this requisition. The findings revealed that, in order to carry out these purchases, a fictitious demand was loaded on the SAP system and manually run as material requirements planning, allowing the planner to create a requisition and eventually a purchase order. It was clear that inventory management controls were ineffective, and thus a sustainable inventory management system needed to be developed to prevent such things from happening. It was also found that the company procured more than was needed because re-order point levels were not maintained on the system.
Third, the frequent changes of order quantities led to increases in excess stock. This pointed to a lack of proper policies to manage the ordering process. The analysis established that Company X allowed customers to change their order quantities or to cancel orders in the middle of a production process. This left Company X with excess stock that could not be consumed.
The study also found that there were no effective policies for ordering materials for production and maintenance. "Demand changes by customer" was clear evidence that there was no policy to govern the master production schedule, which had no restrictions. Neither demand nor planning time fences were being used at Company X. The Enterprise Resource Planning (ERP) system, which Company X used, has the capacity to configure a demand time fence and a planning time fence for each master scheduled end item. The master scheduling planning horizon is often set up to include at least cumulative lead time plus a timer for low-level component lot sizing adjustments and capacity changes for important work centres or key suppliers, and time fences are built into the planning horizon to regulate acceptable changes.
Fourth, it was reasonable to attribute the reasons for excess inventory to three distinct problems with design specification changes: design changes, quality issues, and specification changes. It was evident that a product design methodology, in which a prototype must be developed before actual production, was not being followed. Changes in specification allowed BOM changes; and the BOM structure always describes the relationship between the finished item and the components needed to create, assemble, or repair it. BOMs are critical for inventory management planning teams because they enable them to anticipate and order the proper quantity of each component needed to complete the final product. Changes in BOM result in excess stock, as happend at Company X.
Fifth, with regard to the wrong items being procured, there were two key secondary causes: duplicate material numbers and a communications gap. The researcher found that there was no established material master policy in Company X for creating item numbers in SAP. There were several items with different items numbers but with the same description. Because the items were not linked to any demand, the material planner would create a planned independent requisition and run material requirements planning manually to source these items. There was also a communications gap between production planning, procurement, and operations, and wrong items were procured as a result.
Sixth, the company had several internal practices that contributed to excess stock. First, suppliers encouraged Company X to buy in bulk and so receive discounts through the sourcing/procurement function. Although this might help to gain procurement savings, if done in an uncontrolled way it leads to excess stock. Such purchases were completed, for instance, for goods with sporadic demand. They negotiated current year demand using historical yearly demand amounts while naïvely assuming that the demand quantity from the previous year would remain the same for the upcoming year. Since sporadic SKUs have occasional demand periods, they frequently end up in excess stock. It was evident that Company X lacked a reverse logistics policy, as there was erratic demand, rushing to purchase material without secured orders, intuition buying, unknown methods for holding spares linked to fleets, and spare parts agreements entered with Company X Freight Rail, which as a customer determined the quantity that Company X had to keep. Afolabi et al. [54] established a positive interdependent relationship between inventory and logistics systems, and suggested an integrated system of inventory and logistics to make it sustainable. Orobia et al. [55] also found a positive relationship between inventory and managerial competence in relation to financial performance. Thus, managerial decisions influence inventory, which in turns determines the financial performance of an organisation.
4.3. Strategies to generate value from the excess inventories held by Company X
It was evident that Company X managers had no strategies to get rid of the inventory that was no longer useful. The data showed that 34% of the excess stock was a result of changes in specification, 17% of the items were bought without a confirmed demand, and 13% of the items were for parked/staged fleet. The research showed that Company X was providing for the whole R1.2 billion of excess stock, yet management still considered these items a safety net. It was also evident that inventory holding costs were not considered at Company X.
The management of excess inventory could be accomplished using a variety of techniques and tactics, according to the research findings. Most studies suggest a life cycle approach in managing excess inventory. Nnamdi [19] created a management toolkit for managing and controlling excess inventory; the model is presented in Figure 7.
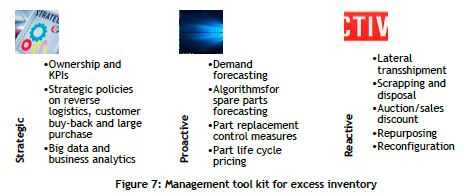
It was suggested that, in order to manage and eliminate surplus inventory, a combination of strategic action, and operational reactive and operational proactive methods was required [19].
5. CONCLUSION AND RECOMMENDATIONS
This study considered inventory technology and operations techniques for reducing and controlling excess inventory in an effort to develop a sustainable inventory management system for manufacturing industries, using Company X as a case study. According to the study's results, Company X did not have a structured way of controlling excess inventories. The company used an ERP system to manage ordering of inventory, different costs, and lead times. However, it lacked a sufficient system, procedure, and control for ordering inventories, which is what started the company's problems.
It was evident that Company X managers had no strategies to get rid of the inventory that was no longer useful.
The study's main finding is that management should prioritise and concentrate on these five areas that account for the 78.8% of all excess inventory that is categorised as bought without a confirmed demand, parked/staged fleet, changes in specification, spares take-on, and demand changes by clients.
This study could serve as a model for future work with inventory management improvements for rail manufacturing companies, and could be helpful for other studies in the same field. Company X should salvage a minimum of R450.643 million out of the R732.675 million that is pure excess stock. This could be achieved by repurposing, lateral transhipment, returns to suppliers, and selling all coach items. It is recommended that Company X redefine ownership and its KPIs, and that it delegate to the inventory planning team the duty of controlling, overseeing, and reducing the excess stock to a certain percentage value of excess annually.
Although it has drawn on the literature and on managerial reports, this study has some limitations. The first is that only one case company is taken into account. This means that, while the examined causes of excess stock and the developed inventory management system would be appropriate for rolling stock environments, future studies in other contexts could study different or additional aspects, depending on the nature of the market and the industry. The skill sets (relevant qualifications) capacity aspect of inventory management experience was not recognised as a highly relevant factor in the case study; however, it might have a significant impact in other situations. Future research could investigate the impact of a lack of relevant experience and skill in inventory planning on the accumulation of excess stock. Supply chain managers could balance supply and demand using the sales and operations planning process. There is a need to address this limitation in order to support efforts to supplement the demand planning process in rolling stock manufacturing industries. Future studies could also examine other solutions to the excess inventory problem; for instance, it would be useful to investigate the variables that influence markdown, salvation, and donation decisions.
REFERENCES
[1] A. Penny, M. F. Mpwanya & K. R. Lambert. 2021. Investigating the efficacy of inventory policy implementation in selected state-owned enterprises in the Gauteng province: A qualitative study. Journal of Transport and Supply Chain Management, 15(0), a552. [ Links ]
[2] N. Sohail & T. H. Sheikh. 2018. A study of inventory management system case study. Journal of Advanced Research in Dynamical & Control Systems, 10(10), pp. 1176-1190. [ Links ]
[3] P. Derby & P. Molefe. 2020. Transnet integrated report 2020. [Online] Available at: https://www.transnet.net/search/pages/results.aspx?k=integrated%20report%202020 [Accessed 17 November 2021]. [ Links ]
[4] H. Shteren & A. Avrahami. 2017. The value of inventory accuracy in supply chain management: Case study of the Yedioth Communication Press. Journal of Theoretical and Applied Electronic Commerce Research, 12(2), pp. 71-86. [ Links ]
[5] P. M. Muchiri & M. Moronge. 2018. Determinants of implementation of inventory management practices in fast moving consumer goods manufacturing firms in Nairobi County, Kenya. The Strategic Journal of Business & Change Management, 5(3), pp. 533-554. [ Links ]
[6] F. A. Khalid & S. R. Lim. 2018. A study on inventory management towards organizational performance of manufacturing company in Melaka. International Journal of Academic Research in Business and Social Sciences, 8(10), pp. 1216-1227. [ Links ]
[7] S. Aniyruddh & K. H. Kiran. 2018. Inventory problems faced by Nike. International Journal of Pure and Applied Mathematics, 120(5), pp. 4283-4293 [ Links ]
[8] H. Srour & A. Azmy. 2021. Inventory management and its impact on the firm performance. World Research of Business Administration Journal, 1(1): pp. 45-65 [ Links ]
[9] F. Khan & D. A. Siddiqui. 2019. Impact of inventory management on firm's efficiency: A quantitative research study on departmental stores operating in Karachi. Social Science and Humanities Journal, 3(4), pp. 964-980. [ Links ]
[10] P. Khobragade, R. Selokar & M. Talmale. 2018. Research paper on inventory management system. International Research Journal of Engineering and Technology, 5(4), pp. 252-254. [ Links ]
[11] T. Althaqaf. 2020. Effect of inventory management on financial performance: Evidence from the Saudi manufacturing company: Case study. European Journal of Accounting, Auditing and Finance Research, 8(10), pp. 13-26. [ Links ]
[12] A. Mishra & H. A. Salunkhe. 2018. A study of inventory management system of Linamar India Pvt. Ltd, Pune. Amity Journal of Operations Management, 3(1), pp. 35-41. [ Links ]
[13] M. Riza, H. H. Purba & M. Mukhlisin. 2018. The implementation of economic order quantity for reducing inventory cost. Research in Logistics and Production, 8(3), pp. 207-216. [ Links ]
[14] G. Sarma. 2017. The impact of inventory management on manufacturing industry. International Journal of Business and Management Invention, 6(1), pp. 01-09. [ Links ]
[15] W. U. Urissa. 2019. Assessing challenges of inventory management pratice (in case of Dubo Primary Hospital). Industrial Engineering Letters, 9(1), pp. 1-8. [ Links ]
[16] A. Gurtu. 2021. Optimization of inventory holding cost due to price, weight, and volume of items. Journal of Risk and Financial Management, 14(65), pp. 1-11. [ Links ]
[17] M. Muller. 2019. Essentials of inventory management 3rd ed. New York, NY: HarperCollins Leadership. [ Links ]
[18] Y. Tadayonrad & A. B. Ndiaye. 2023. A new key performance indicator model for demand forecasting in inventory management considering supply chain reliability and seasonality. Supply Chain Analytics, 3,100026. [ Links ]
[19] O. Nnamdi. 2018. Strategies for managing excess and dead inventories: A case study of spare parts inventories in the elevator equipment industry. Operations and Supply Chain Management, 11(3), pp. 128-139. [ Links ]
[20] J. George & V. M. Pillai. 2019. A study of factors affecting supply chain performance. Journal of Physics: Conference Series, 1355(1), 012018. [ Links ]
[21] L. S. Negi & Y. Kharde. 2021. Identifying the root causes for inventory accumulation and prioritizing them using an MCDM-based TOPSIS approach. Modern Supply Chain Research and Applications, 3(2), pp. 145-154. [ Links ]
[22] E. Ngugi. 2019. Effects of inventory management systems on performance of manufacturing companies in Eldoret Town, Kenya. Munich, Germany, GRIN Verlag. [ Links ]
[23] L. Bolaños & C. J. Vidal. 2021. The impact of inventory holding costs on the strategic design of supply chains. Revista Facultad de Ingeniería, Universidad de Antioquia, 101(1), pp. 45-54. [ Links ]
[24] E. Halilović , H. Bajrić, K. Melin & E. Neimarlija. 2023. Strategies for reducing excess and obsolete inventory. In: Karabegovic, I., Kovacevic, A., Mandzuka, S. (eds) New Technologies, Development and Application VI. NT 2023. Lecture Notes in Networks and Systems, 687, pp. 396-410. Springer, Cham. [ Links ]
[25] P. Pourhejazy. 2020. Destruction decisions for managing excess inventory in e-commerce logistics. Sustainability, 12(8365), pp. 1-12. [ Links ]
[26] N. K. Sugiono & R. S. Alimbudiono. 2020. Slow moving and dead stock: Some alternative solutions. Surabaya, Indonesia, Atlantis Press SARL. [ Links ]
[27] D. Y. Mo, Y. Wang, D. C. K. Ho & K. H. Leung. 2020. Redeploying excess inventories with lateral and reverse transshipments. International Journal of Production Research, 60(10), pp. 3031-3046. [ Links ]
[28] R. Chithraponnu & S. Umamaheswari. 2022. Blood inventory management: Cross-matching policy with A1A2BO substitution for age-dependent demand. International Conference on Allied Health Sciences (ICAHS), Chennai, India. [ Links ]
[29] R. R. Panigrahi & D. Jena. 2020. Inventory control for materials management functions: A conceptual study. In Patnaik S., Ip A., Tavana M., & Jain V. (eds), New paradigm in decision science and management. Proceedings of ICDSM 2018. Singapore, Springer. [ Links ]
[30] N. A. Kurdhi & R. I. Doewes. 2019. Periodic review inventory policy with variable ordering cost, lead time, and backorder rate. Journal of Science and Technology, 41(1), pp. 1-11. [ Links ]
[31] P. Arismawati & W. A. Prastyabudi. 2021. An inventory policy on agroindustry supply chain: A case study of fruit seasonal in East Java. Food & Agribusiness Management (FABM), 2(2), pp. 46-50. [ Links ]
[32] T. E. Goltsos, A. A. Syntetos, C. H. Glock & G. Ioannou. 2022. Inventory-forecasting: Mind the gap. European Journal of Operational Research, 299(2), pp. 397-419. [ Links ]
[33] I. Rizkya, K. Syahputri, R. M. Sari, Anizar, I. Siregar & E. Ginting. 2017. Comparison of periodic review policy and continuous review policy for the automotive industry inventory system. IOP Conference Series: Materials Science and Engineering, 288, 012085. [ Links ]
[34] B. I. May, M. P. Atkinson & G. Ferrer. 2017. Applying inventory classification to a large inventory management system. Journal of Operations and Supply Chain Management, 10(1), pp. 68-86. [ Links ]
[35] M. R. Douissa & K. Jabeur. 2016. A new model for multi-criteria ABC inventory classification: PROAFTN method. Procedia Computer Science, 96, pp. 550-559. [ Links ]
[36] L. Abualigah, D. Yousri, M. A. Elaziz, A. A. Ewees, M. A.A. Al-qaness & A. H. Gandomi. 2021. Aquila optimizer: A novel meta-heuristic optimization algorithm. Computers & Industrial Engineering, 157, 107250. [ Links ]
[37] R. M. Sharma & C. P. Agrawal. 2022. MH-DLdroid: A meta-heuristic and deep learning-based hybrid approach for android malware detection. International Journal of Intelligent Engineering and Systems, 15(4), pp. 425-435. [ Links ]
[38] M. Shajalal, P. Hajek & M. Z. Abedin. 2023. Product backorder prediction using deep neural network on imbalanced data. International Journal of Production Research, 61(1), pp. 302-319. [ Links ]
[39] B. Huang & A. Wu. 2016. EOQ model with batch demand and planned backorders. Applied Mathematical Modelling, 40(9-10), pp. 5482-5496. [ Links ]
[40] R. Li, H-L.Yang, Y. Shi, J-T. Teng & K.-K. Lai. 2021. EOQ-based pricing and customer credit decisions under general supplier payments. European Journal of Operational Research, 289(2), pp. 652-665. [ Links ]
[41] R. Mondal, R. K. Jana, P. Pramanik & M. K. Maiti. 2023. A fuzzy EOQ model for deteriorating items under trade credit policy with unfaithfulness nature of customers. In Sahoo, L., Senapati, T. & Yager, R. R. (eds), Real life applications of multiple criteria decision making techniques in fuzzy domain. Singapore, Springer. https://doi.org/10.1007/978-981-19-4929-6_21 [ Links ]
[42] S. T. Khorasani & M. Almasifard. 2017. An inventory model with quantity discount offer policy for perishable goods in the two-level supply chain. International Journal of Engineering and Technology, 9(4), pp. 2828-2834. [ Links ]
[43] K. P. Mubiru. 2013. An EOQ model for multi-item inventory with stochastic demand. International Journal of Engineering Research & Technology, 2(7), pp. 2485-2492. [ Links ]
[44] B. Maddah, M. Kharbeche, S. Pokharel & A. Ghoniem. 2016. Joint replenishment model for multiple products with substitution. Applied Mathematical Modelling, 40(17-18), pp. 7678-7688. [ Links ]
[45] T. R. Jonrinaldi, E. W. Henmaidi & D. W. Zhang. 2018. A multiple items EpQ/EOQ model for a vendor and multiple buyers system with considering continuous and discrete demand simultaneously. IOP Conference Series: Materials Science and Engineering, 319, 012037 [ Links ]
[46] L. Eksler, R. Aviram, A. Elalouf & A. Kamble. 2019. An EOQ model for multiple products with varying degrees of substitutability. Economics: The Open-Access, Open-Assessment E-Journal, 13(1), pp. 1-15. [ Links ]
[47] S. Khalilpourazari, S. H. R. Pasandideh & S. T. A. Niaki. 2019. Optimizing a multi-item economic order quantity problem with imperfect items, inspection errors, and backorders. Soft Computing, 23(1), pp. 11671-11698. [ Links ]
[48] Y. W. Lok, S. S. Supadi & K. B. Wong. 2022. EOQ models for imperfect items under time varying demand rate. Processes, 10(1220), pp. 1-16. [ Links ]
[49] P. Kaur, J. Stoltzfus, & V. Yellapu. 2018. Descriptive statistics. International Journal of Academic Medicine, 4(1), pp. 60-63. [ Links ]
[50] M. J. de Smith. 2021. Statistical analysis handbook: A comprehensive handbook of statistical concepts, techniques and software tools. Winchelsea, UK, The Winchelsea Press. [ Links ]
[51] S. K. Biswas, C. Karmaker, A. Islam, Hossain, N. & S. Ahmed. 2017. Analysis of different inventory control techniques: A case study in a retail shop. Journal of Supply Chain Management System, 6(3), pp. 35-45. [ Links ]
[52] K. S. O'Neill. 2018. Applying the Pareto principle to the analysis of students' errors in grammar, mechanics and style. Education Resources Information Center, 34(1), pp. 1-12. [ Links ]
[53] A. Gurtu. 2021. Optimization of inventory holding cost due to price, weight, and volume of items. Journal of Risk and Financial Management, 14(2), 65. [ Links ]
[54] O. J. Afolabi, K. O. Morakinyo & O. F. Odeyinka. 2017. Evaluation of the role of inventory management in logistics chain of an organisation. Scientific Journal on Transport and Logistics, 8(2), pp. 1-11. [ Links ]
[55] L. Orobia, B. Juma, & R. Akisimire. 2020. Inventory management, managerial competence and financial performance of small businesses. Journal of Accounting in Emerging Economies, 10(3), pp. 2042-1168 [ Links ]
Submitted by authors 11 July 2025
Accepted for publication 18 Nov 2025
Available online 12 Dec 2025
* Corresponding author afolabiilesanmi@yahoo.com
ORCID® identifiers
M.R. Molokoane
https://orcid.org/0009-0009-6609-5034
O. Makinde
https://orcid.org/0000-0003-1609-688X
K.R. Ramdass
https://orcid.org/0000-0001-5480-3368
I. Daniyan
https://orcid.org/0000-0002-7238-9823
H.S. Phuluwa
https://orcid.org/0009-0008-4399-5155
