



Services on Demand
Journal

Article
 English (pdf)
 Article in xml format
 Article references

 Automatic translation
 Send this article by e-mail
Indicators
Related links
-
 Cited by Google
-
 Similars in Google
Share

 Permalink

Journal of the Southern African Institute of Mining and Metallurgy
On-line version ISSN 2411-9717Print version ISSN 2225-6253
J. S. Afr. Inst. Min. Metall. vol.124 n.11 Johannesburg Nov. 2024
https://doi.org/10.17159/2411-9717/3382/2024
PROFESSIONAL TECHNICAL AND SCIENTIFIC PAPERS
Re-evaluation of the PlatMine chromitite pillar strength database
B.P. Watson; M.I. Mabala; M.J. Kanda
University of the Witwatersrand, Johannesburg, South Africa. ORCiD: B.P. Watson: http://orcid.org/0000-0003-0787-8767; M.I. Mabala: http://orcid.org/0009-0002-1486-3715; M.J. Kanda: http://orcid.org/0000-0002-1220-855X
ABSTRACT
A failed and stable Upper Group 2 chromitite pillar database was collected in 2007 as part of the PlatMine 1.2 pillar strength project. The database consisted of 177 pillars, of which 33 had failed. Most of the data were collected from various intermediate-depth mines near the town of Thabazimbi. Spans between rows of chain pillars were about 30 m. Pillar loads were estimated using pseudo-3D, elastic, boundary element modelling software. The pillar-load data were evaluated using a maximum likelihood regression analysis to determine strength parameters, following a similar approach to historically acceptable practice. The original formula was named the PlatMine Formula. This paper describes re-evaluations of the database, using a linear formula and several variations of the power formula. The formula providing the lowest standard deviation to the data in the database was considered the best representation of the pillars in the database. Through this rigorous process, a new formula for peak pillar strength was developed for Upper Group 2 chromitite pillars, which is unaffected by volume. The small standard deviation provided by this formula suggests a reliable relationship between strength and w/h ratio, in the w/h ratio range between 1.5 and 4.7. Accuracy, precision, and recall analysis confirmed the efficacy of this equation to the data in the database. Importantly, the new formula provided in the paper does not predict a significantly different strength to the current PlatMine formula, within the confines of the database.
Keywords: UG2 pillars, strength formula, chromitite pillars, back-analysis, pillar design
Introduction
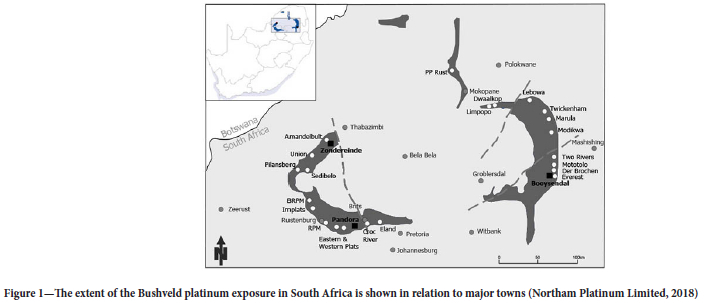
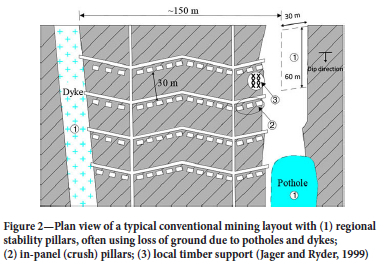
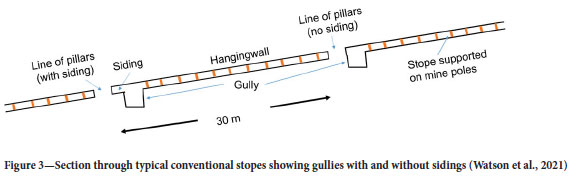
The South African Bushveld Complex is a large layered igneous intrusion in the northern part of the country (Figure 1). The platinum group metals are mined from two tabular orebodies that dip at about 8° to 15° towards the centre of the complex and are known as the Merensky and Upper Group 2 (UG2) Reefs. This paper will deal with the pillar strength of the UG2 Reef, which comprises one or more chromitite seams of about 0.7 m to 1.4 m in thickness (Watson, et al., 2008). Mining is extensive in the western part of the complex, and generally, the Merensky Reef was mined out first, without having considered subsequent mining on the UG2 Reef. The depth of mining extends down to about 1 400 m, which can be considered as 'Intermediate (medium) mining depth' (Jager and Ryder, 1999), and is susceptible to stope collapses, or colloquially known as 'backbreaks' (Roberts, et al., 1997). A high-resistance support system is therefore required, and this is achieved using in-stope pillars. Most of the mining on the western side of the Bushveld was done using a conventional method that makes use of crush chain pillars, which are between 30 m wide panels (Figure 2). The pillar lines are oriented either on strike for breast mining (Figure 2), or dip for up-and down-dip mining. For a breast mining configuration, the in-panel pillars are often located 1.5 m to 2.0 m below a gully (Figure 3). (The gully is used to assist with ore removal to the boxholes or local orepasses.) The zone between the gully and the pillar is termed a siding (Figure 3). Many of the shallower operations did not make use of sidings, meaning that the in-panel pillars were higher on the gully side than on the panel side. Gully heights varied between 1.8 m and 2.5 m. Thus, typical pillars under these conditions could have a height of about 2.3 m on the up-dip side and 1.5 m on the down-dip side, respectively.
Mechanization has increased bord-and-pillar mining, particularly in the newer, shallow-depth workings of the UG2 reef. The Hedley and Grant formula (Hedley and Grant, 1972), developed for Canadian uranium mines, was adopted for pillar design. This formula's rock mass strength component was generally reduced to about a third of the laboratory-determined uniaxial compressive strength (UCS) of UG2 chromitite. A value of 35 MPa was widely used (Malan and Napier, 2011). Many assumptions used in the formulation of this equation are unproven, and therefore the use in the design of UG2 pillars is questionable (Malan and Napier, 2011). A potential consequence of using this uncertain methodology is to cut oversized pillars, which lowers the extraction ratio.
In the Rustenburg area, the two reefs are far apart vertically, so there is little stress interaction between the two reefs. However, in the Thabazimbi area, the reefs are much closer to each other. In this environment, it was possible to observe UG2 pillars cut in a destressed environment and under high-stress conditions. The high stresses occurred where the UG2 Reef was mined under or near stability pillars left on the Merensky Reef. In such instances, pillars often ranged from solid and stable to failed or crushed in a single panel. A database of 167 pillars was collected in this area as part of the PlatMine 1.2 pillar strength project (Watson et al., 2007). The PlatMine database and initial evaluation of a formula for UG2 pillar strength are described in Watson et al. (2021).
The PlatMine database consisted of 134 stable pillars where the modelled stresses were below the best-fit strengths and 33 pillars provided stresses somewhat higher than the strengths. Most of the pillar width-to-height (w/h) ratios were between 1.5 and 4, with the largest proportion being between 2.0 and 3.0. The condition of the pillars was assessed visually and the possible stress on each pillar, at the date of observation, was determined using MinSim (COMRO, 1981), a pseudo-3D elastic displacement-discontinuity, boundary element model. Validation of the modelling results was done using analytical solutions (where possible), and by comparing the MinSim results to MINF (Spottiswoode and Milev, 2002). The analysis suggested an error of less than 10% in the average pillar stress (APS). Since the failure date of the pillars was not known, the strengths of many of the failed pillars in the database were overestimated by the models, and vice versa for stable pillars. It was, therefore, necessary to use a similar analysis approach as Salamon and Munro (1967) to determine a suitable equation. A maximum likelihood regression analysis was used to find the best fit to the available data by assuming a power formula and varying the values of the unknown exponents (α and β) and 'k', as shown in Equation [1]. The research described in this paper focuses on a re-evaluation of the PlatMine database.

Literature review
Various empirical formulae have been derived to design pillar dimensions based on pillar strength demand in coal and hard rock mines. Most of these formulae use the power-law and linear functions with various derivatives. Notable contributions have been made by authors such as Salamon and Munro (1967), Hedley and Grant (1972), Bieniawski and Van Heerden (1975), Von Kimmelmann et al. (1984), Lunder and Pakalnis (1997), York and Canbulat (1998), Van der Merwe and Mathey (2013), Watson et al. (2021), Oates and Malan (2023), and many others. Despite the vast amount of research that has been done over almost five decades, most of these formulae lack sufficient data to provide confident statistical evaluations (Oates and Malan, 2023). There remains considerable uncertainty about the contributions of various strength parameters, and the current empirical formulae are only applicable to specific reef formations characterized by specific geological and geomechanical conditions. While the PlatMine formula (Watson et al., 2021) has demonstrated a notable increase in predicted UG2 pillar strength compared to traditional formulae, it has faced criticism for its tendency to forecast strength increase with an increase in volume.
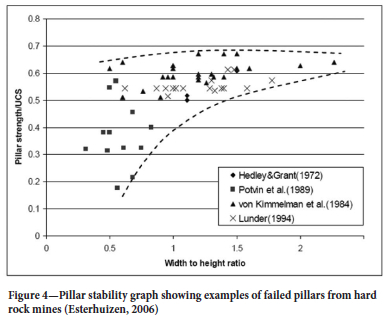
The pursuit of a 'universal' strength equation remains elusive, primarily due to the challenge of reconciling many strength parameters into a single, simplistic equation. Since most of the simplistic equations are empirical, it stands to reason that a separate formula should be determined for each reef type. A further complication was described by Esterhuizen (2006) when the pillar w/h ratio fell below 1.5 (Figure 4). The results of his investigation suggest that a significant increase in variability occurs where the w/h ratio drops below 1.5. Oke and Esterhuizen (2017) showed that the influence of structure has a major influence on the stability of slender pillars. Zipf (2001), recorded that slender pillars have little load-bearing capacity. It was therefore decided that one of the re-evaluations of the PlatMine database should exclude all pillars with a w/h ratio of less than 1.5.
Laboratory testing
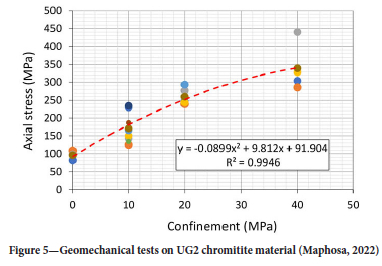
Geomechanical laboratory tests were conducted on UG2 chromitite material (Maphosa, 2022). The results showed strong non-linear tendencies at low confinements (Figure 5). The laboratory results suggested that the UG2 pillars may also behave in a non-linear fashion and a power formula may therefore be more applicable than a linear formula to these pillars.
PlatMine database re-evaluation
Very little research has been conducted to develop reef-type specific pillar strength formulae for the hard rock mines in South Africa.
Considering the importance of designing UG2 pillars confidently, and the difficulties of collecting reliable data due to the ductile nature of chromitite, a decision was made to re-evaluate the existing PlatMine database. The published PlatMine formula (Watson et al., 2021) suggested a power relationship. Combinations of the unknown parameters in the formula (α, β and k) were varied iteratively until the lowest deviation coefficient was achieved. None of the parameters were manipulated. However, the final formula provided by Watson et al. (2021) suggested an increased strength with volume, which required further investigation. The re-evaluations described in this report include a linear formula and various forms of the power formula. The chosen linear formula (Scenario 1) was originally suggested by Bieniawski and Van Heerden (1975), and confirmed by York and Canbulat (1998). A modification for pillar length was added for rectangular pillars, as described by Watson et al. (2008):

Where: ki is the large-scale in situ cube strength, 'a' and 'b' are empirically determined factors for evaluating the strengthening effects of pillar length (for rectangular pillars) and w/h ratio, respectively.
Three different circumstances were considered for the power formula analyses:
> The β-exponent was fixed and varied manually until the α, and β-values were equal (Scenario 2). This analysis was adopted to understand the implication of eliminating of the volumetric effect.
> The α and β exponents proposed by Hedley and Grant (1972) were fixed and only the k-value was varied in the analysis (Scenario 3) to determine the efficacy of using this widely applied formula on the data in the database.
> All pillars with a w/h ratio of less than 1.5 were removed from the database (Scenario 4). The α and β-exponents were fixed at the same values as the PlatMine formula, and the k-value was determined by the analysis.
The standard deviation from a lognormal distribution (deviation coefficient) was calculated in every evaluation and used to determine the equation's effectiveness. This standard deviation (10±s) was evaluated regarding unity (Ryder et al., 2005). A lower deviation coefficient was considered to provide a more reliable strength law. The pillar conditions scale was coded as 'stable' or 'failed. Safety factors (SF) greater than unity were classified and coded as 'Stable' and those values less than unity as 'failed'. The original PlatMine formula for UG2 pillar strength (Watson et al., 2021) is:

Where σp is the pillar strength, and We and he refer to the effective pillar width and height, respectively. The we parameter was determined using the Wagner (1974) formula for rectangular pillars:

Where L is the pillar length
An 'effective height' (he) was calculated to allow for the presence of gullies adjacent to pillars. It was only used in the absence of a siding (Sd). The correction is based on numerical modelling by Roberts et al. (2002):

Results
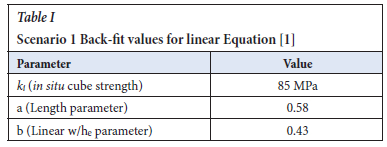
Scenario 1 involved the application of the linear formula as shown in Equation [1]. The back-fitted parameters from the database are shown in Table I.
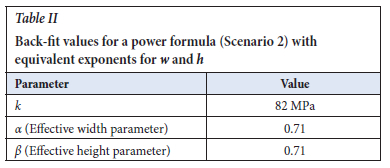
The parameters of Scenario 2 are for the power formula (Equation [1]), where the volumetric effects on pillar strength were eliminated by assuming equal values for α and β. The results are provided in Table II and Equation [6].

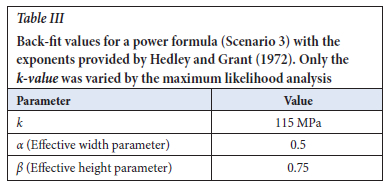
In Scenario 3, the database was evaluated using the exponents suggested by Hedley and Grant (1972) and the analysis was only allowed to determine the k-value from the database. The k-value parameter resulting from the investigation and the input values are provided in Table III. Table III only shows the input parameters and not the results. Note that the k-value was the result.
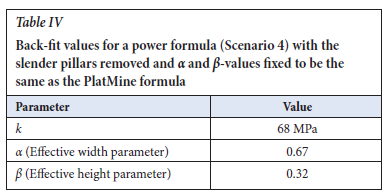
The consideration in Scenario 4 was for a database with all pillar w/h ratios of less than 1.5 removed. The exponents (α and β) were fixed to be the same as the PlatMine formula, and the analysis evaluated the k-value. The k-value parameter resulting from the investigation and the input values are provided in Table IV.
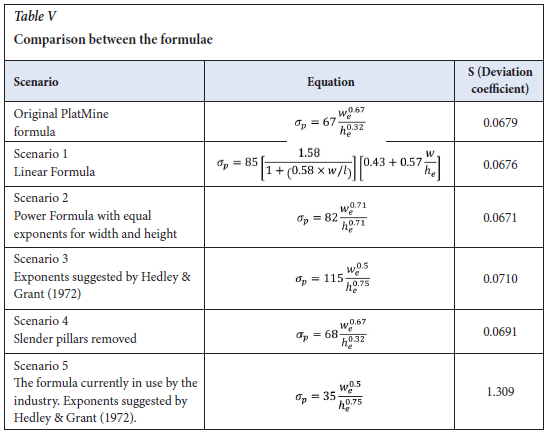
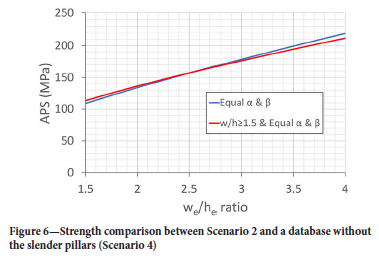
Comparisons were made between the various scenarios, the original PlatMine formula (Equation [3]) and the formula currently in use in the industry (Malan and Napier, 2011). The deviation coefficient was assumed to be a measure of the fit to the data in the database. A lower value indicates a better fit. The results showed that Scenario 2 provided the best solution and a better formula than the original PlatMine expression (Table V). The fact that Scenario 2 is slightly better than the linear formula, agrees with the non-linear behaviour of the laboratory test results in Figure 5. The removal of the slender pillars from the database had little effect on the strength results within the confines of the database (Figure 6). However, the deviation coefficient was significantly less for the original PlatMine formula, suggesting that the slender pillars did not have a negative effect on the database. The formula currently in use by the industry (Scenario 5 in Table V) shows the highest deviation coefficient (worst fit) to the data in the database.
Verification of the results in Table V
Further analyses were carried out by comparing the predicted SF of each scenario described in Table V to the actual observed pillar conditions in the database. The aim was to identify the scenario/s that best predicted the observed conditions. To facilitate the comparison, predicted SF and pillar condition codes were transformed into two classes, representing 'stable' and 'failed' conditions:
SF > 1 = 'stable'
SF < 1 = 'failed'
The pillar conditions scale as illustrated by Watson et al. (2021) was also re-classified and coded as follows: 'stable' if the pillar condition code is less than 3, and 'failed' if the pillar conditions code is greater than 3. The result of the data re-coding was such that the database and the scenarios had a new data field with two classes, i.e. 'stable' or 'failed'.
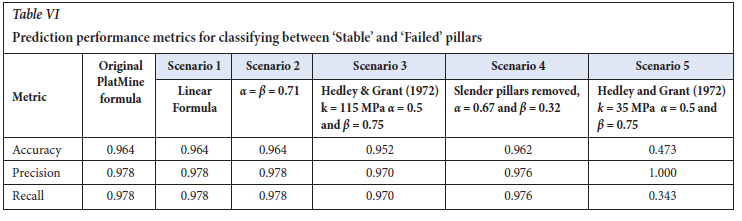
The observed pillar conditions data ('stable' or 'failed') from the database were compared to the estimated data from the scenarios. The comparison allowed for the determination of the performance of all the variations of the pillar formulae (i.e., scenarios) used in classifying whether a pillar would 'fail' or be 'stable, based on the input parameters of its width and height. The analysis of the performance of the formulae and the varying parameters was evaluated, based on established metrics for classification models, i.e., accuracy, precision, and recall. The terms are described as:
> Accuracy: a measurement of how the model correctly predicted the failure of pillars. In other words, the rate at which the model predicts a pillar to be 'stable' and the pillar is indeed stable (or has been observed to be stable). It also measured the rate at which a pillar was predicted to have failed and is found to be failing. It is the overall correctness of the predictions. Careful consideration must be taken when using accuracy to evaluate the performance of a model. This is especially true when dealing with unbalanced data, as is the case in this database. Only 25% of the samples in the database showed instances of failure while 75% illustrated stable conditions. It was therefore important to evaluate accuracy together with other measures, such as precision and recall.
> Precision is the ratio of true positive predictions to the total number of positive predictions (true positives + false positives). Note that in this case, a positive prediction was set to be the 'stability' classification. Precision asks: What proportion of 'stability' estimates was correct? That is, it reported how many of the pillars that were predicted to be stable, are stable. Precision is useful in the cases where a false positive (i.e., a pillar being predicted to be 'stable', and it is found not to be stable) is of higher concern than a false negative (i.e., a pillar predicted to have 'failed' and found rather to be 'stable'). The cost of the false positives is that the pillars would be under-designed, and the consequence could cost lives, which is a higher price to pay than an overdesign that could be merely regarded as a more conservative design. Thus, when choosing a performance metric, precision was considered the most crucial in this study, however, it should be carefully studied along with other metrics.
> Recall (sensitivity) explained how many of the actual positive (i.e., 'stable' predictions) cases were predicted correctly. It is the ratio of true positives predicted divided by the total number of actual positives.
Table VI indicates that Scenario 1 (linear formula) and Scenario 2 (α = β = 0.71) achieve the same levels of accuracy, precision, and recall. In contrast, Scenario 5 (Hedley and Grant, 1972) demonstrates the poorest performance in accuracy and recall. While precision is the most critical metric in this study, it is important to note that Scenario 5, despite exhibiting 'perfect precision,' has very low recall. This high precision/low recall combination arises when a model is overly cautious in predicting stable pillars. Although Scenario 5 is always correct when it labels a pillar as stable, it misses many stable pillars, labelling them as unstable. For instance, Scenario 5 incorrectly classifies 88 stable pillars as unstable. Using Scenario 5 would lead to pillar overdesign due to its extreme conservatism. Considering all metrics, Scenario 1 and Scenario 2 show superior performance with a better balance between precision and recall.
Figure 7 provides a confusion matrix, showing the true positives (TP), false positives (FP), true negatives (TN), and false negatives (FN) found in all the scenarios:
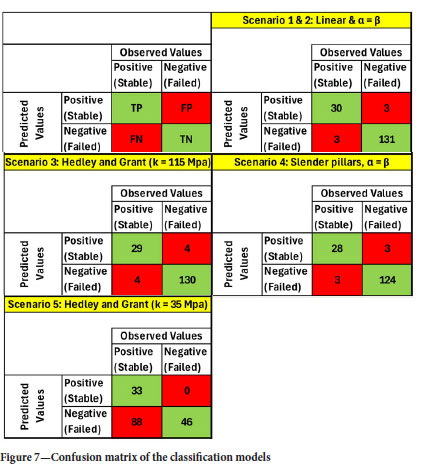
> TP: When the model predicted the 'stability' of a pillar, and it was true.
> TN: When the model predicted a 'failed' pillar and it was true.
> FP (Type 1 error): When the model predicted the 'stability' of a pillar, but it was false (i.e., the pillar had failed).
> FN (Type 2 error): When the model predicted a 'failed' pillar, but it was false (i.e., the pillar was stable).
The performance matrices of Scenario 1 (linear formula), and Scenario 2 (α = β = 0.71) showed similar results in correctly classifying the pillars' stability and failure. Moreover, the models from these scenarios outperformed the alternatives. Out of 167 predictions, the pillars were classified accurately 161 times. However, it is concerning that there were three instances where the pillars were classified as stable when they were not (i.e., false positives), which could pose a risk to human lives due to the potential pillar designs having been based on false positives. This occurred 2.24% of the time for Scenarios 1 and 2. FP rates for Scenario 3 (Hedley and Grant, 1972) - exponents only, Scenario 4 (slender pillars) and Scenario 5 (formula currently used by the industry) were 2.99%, 2.36%, and 0.00% respectively. Conversely, the false negative rates (FNR) for Scenarios 1 and 2 are the lowest at 9.09%, while FNR for Scenarios 3, 4, and 5 are 12.12%, 9.68% and 72.73%, respectively.
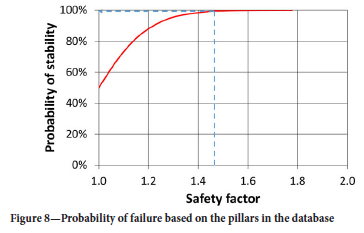
All risk of false positives in the database when using Scenario 2 (Equation [6]) can be mitigated by a safety factor of 1.17. For uncertainty quantification using the deviation coefficient associated with Scenario 2, a probabilistic approach suggests that a safety factor of 1.6 would provide a confidence of stability of 99.9% for the data in the database (Figure 8).
Discussion
All the analyses performed on the database suggest that Scenario 2 (Equation [6]) provides the best solution to the data in the database, followed closely by Scenario 1 (linear formula). These findings imply that there may not be a volume-strengthening effect as predicted by the original PlatMine Formula. However, it should be noted that the original PlatMine formula only shows a slightly poorer deviation coefficient (Table V), and the prediction performance metrics suggest a similar performance for both equations. In general, the results suggest a non-linear strengthening effect with a w/h ratio, in agreement with the behaviour of the laboratory tests. The results of all the equations are plotted against the w/h ratio for the range of data in the database in Figure 9. The analyses show that similar curves are provided by all the formulae, except the 'commonly used' method (Scenario 5), within the w/h ratio boundaries of the database. Of note is the small difference between the strength results of the original formula and the 'equal α and β' (Equation [6]) in the figure.
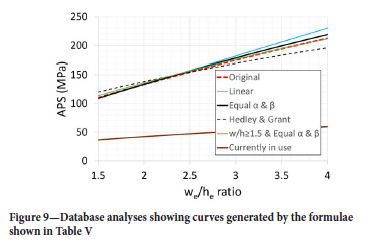
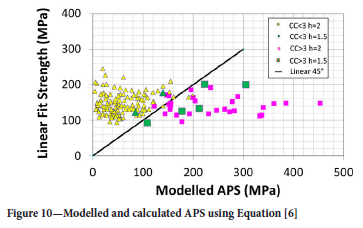
Figure 10 provides a comparison between the average pillar stress (APS) provided by Equation [6] (Scenario 2) and the APS that was determined by the elastic model. The small deviation coefficient ('s' in Table V) suggests that the formula provides a reliable relationship between strength and (w/h)e ratio for the range of pillar we and he in the database. It also indicates a high-quality database. However, it should be noted that there was a limited variation of pillar height in the database, ranging between 1.5 m and 2.0 m. The distribution of 1.5 m high pillars in Figure 10 is illustrated by the green-coloured triangles and squares. The formula provided in Scenario 2 (Equation [6]) may be used for pillars with conditions like those in the database (Esterhuizen, 2014). These conditions are:
> The immediate foundation materials are pyroxenite and anorthosite.
> The pillars should not be weakened by thrust structures or weathering.
> The height should be restricted to between 1.5 m and about 2 m.
> The w/h ratio should be between 1.2 and 4.7.
One of the worst-performing scenarios in all the applied evaluations was Scenario 3 (Hedley and Grant, 1972). The calculated k-value was also significantly higher than the laboratory-determined UCS shown in Figure 5. The evaluations suggest that each rock type may require unique exponents (α and β) and k-value.
Conclusions and recommendations
The PlatMine database for UG2 pillar strength determination is shown to be of high quality. All the analyses of the database (including the prediction performance metrics) suggest that the most appropriate formula for the pillar strength data in the database is Equation [6]. The investigation suggests that the volumetric strengthening effect of pillars shown by the original PlatMine formula may not be true. The analysis implies that unique exponents (α and β) and k may be needed for every rock type.
It should be noted that the prediction of pillar strength by Equation [6] is not significantly different to the original PlatMine formula, within the range of w/h ratios in the database. Equation [6] may be used cautiously on all Bushveld platinum mines with similar geotechnical, geometrical, and geomechanical conditions to the pillars in the database. It should be noted that there was a limited range of pillar heights in the database and therefore the formula should not be used on pillars higher than about 2 m. It is recommended that further work be done to verify Equation [6] in terms of underground measurements, laboratory tests, and numerical modelling. Further research should be done to improve confidence when extrapolating the formula to pillar heights above approximately 2 m.
Acknowledgements
PlatMine is acknowledged for facilitating the collection of data and the original data analysis. The Mandela Precinct is thanked for funding the re-evaluation of the PlatMine database. Dr John Ryder is thanked for his assistance in developing statistical software to evaluate the database.
References
Bieniawski, Z.T., Van Heerden, W.L. 1975. The significance of in situ tests on large rock specimens. International Journal of Rock Mechanics and Mining Sciences & Geomechanical Abstracts. vol. 12, pp. 101-113. https://doi.org/10.1016/0148-9062(75)90004-2 [ Links ]
COMRO. 1981. MINSIM-D User's Manual. Chamber of Mines of South Africa, Johannesburg. [ Links ]
Esterhuizen, G.S. 2006. An evaluation of the strength of slender pillars. SME Annual Meeting, St. Louis, Missouri. [ Links ]
Esterhuizen, G.S. 2014. Extending Empirical Evidence through Numerical Modelling in Rock Engineering Design. The Southern African Institute of Mining and Metallurgy 6th South African Rock Engineering Symposium, vol. 114, pp 251-267. [ Links ]
Hedley, D.G.F., Grant, F. 1972. Stope pillar design for the Elliot Lake uranium mines. Bulletin of the Canadian Institute of Mining and Metallurgy, vol. 65, pp. 37. [ Links ]
Jager, A.J., Ryder, J.A. (Eds.), 1999. A Handbook on Rock Engineering Practise for tabular hard rock mines. The Safety in Mines Research Advisory Committee (SIMRAC), Johannesburg. [ Links ]
Lunder, P.J. 1994. Hard rock pillar strength estimation, an applied approach. MSc thesis, University of British Columbia. [ Links ]
Lunder, P.J., Pakalnis, R. 1997. Determination of the strength of hard-rock mine pillars. Bulletin of the Canadian Institute of Mining and Metallurgy. vol. 90, pp. 51-55. [ Links ]
Malan, D.F., Napier, J.A.L. 2011. The design of stable pillars in the Bushveld Complex mines: a problem solved? Journal of the South African Institute of Mining and Metallurgy, vol. 111, no. 12, pp. 821-836. [ Links ]
Maphosa, T.J. 2022. Optimum depth for the introduction of crush pillars at Impala platinum mine. MSc dissertation, School of Mining Engineering, University of Witwatersrand, Johannesburg, RSA. [ Links ]
Northam Platinum Limited. 2018. Annual Integrated Report 2018. Available at: https://www.northam.co.za/procurement/127-investors-and-media/publications/719-annual-report [Accessed: 7 February 2020]. [ Links ]
Oates, T.E., Malan, D.F. 2023. A study of UG2 pillar strength using a new pillar database. Journal of the South African Institute of Mining and Metallurgy. vol. 123, no. 5, pp. 265-274. http://dx.doi.org/10.17159/2411-9717/2656/2023 [ Links ]
Oke, J., Esterhuizen G.S. 2017. Improving Hard Rock Pillar Design by Including Rock Mass Classification and Failure Mechanisms. Proceedings of 51st US Rock Mechanics/Geomechanics Symposium held in San Francisco, California, USA. [ Links ]
Potvin, Y., Hudyma, M., Miller, H.D.S. 1989. Rib pillar design in open stoping. Bulletin of the Canadian Institute of Mining and Metallurgy, vol. 82, pp. 31-36. [ Links ]
Roberts, D.P., Canbulat, I., Ryder, J.A. 2002. Design parameters for mine pillars: strength of pillars adjacent to gullies; design of stable pillars with w/h ratio greater than 6; optimum depth for crush pillars. SIMRAC GAP617 Final Report. Safety in Mines Research Advisory Committee. Johannesburg. [ Links ]
Roberts, M.K.C., Grave, D.M.H., Jager, A.J., Klokow, J. 1997. Rock Mass Behaviour of the Merensky Reef at Northam Platinum Mine. SARES, Johannesburg, 1997. [ Links ]
Ryder, J.A., Watson, B.P., Kataka, M.O. 2005. Pillar strength back-analyses. PlatMine 1.2, Johannesburg. [ Links ]
Salamon, M.D.G., Munro, A.H. 1967. A study of the strength of coal pillars. Journal of the South African Institute of Mining and Metallurgy. vol. 68, pp. 55-67. [ Links ]
Spottiswoode, S.M., Milev, A.M. 2002. A methodology and computer program for applying improved, inelastic ERR for the design of mine layouts on planar reefs. SIMRAC GAP722 Final Report. SIMRAC. Johannesburg, pp 85. [ Links ]
Van der Merwe, J.N., Mathey, M. 2013. Update of coal pillar strength formulae for South African coal using two methods of analysis. Journal of the Southern African Institute of Mining and Metallurgy, vol. 113, no. 11, pp. 841-847. [ Links ]
Von Kimmelman, M.R., Hyde, B., Madgwick, R.J. 1984. The use of computer applications at BCL Limited in planning pillar extraction and the design of mining layouts. In Design and Performance of Underground Excavations. International Society of Rock Mechanics Symposium, Brown and Hudson, eds., British Geotechnical Society, London, pp. 53-63. [ Links ]
Wagner, H. 1974. Determination of the complete load-deformation characteristics of coal pillars. Proceedings of 3rd International Congress on Rock Mechanics, International Society of Rock Mechanics, Denver, vol. 2B, pp 1076-1082. [ Links ]
Watson, B.P., Kataka, M.O., Leteane, F.P., Kuijpers, J.S. 2007. Merensky and UG2 pillar strength back analyses. PlatMine 1.2, Johannesburg. [ Links ]
Watson, B.P., Lamos, R.A., Roberts, D.P. 2021. PlatMine pillar strength formula for the UG2 Reef. Journal of the Southern African Institute of Mining and Metallurgy, vol. 121, no. 8, pp. 437. http://dx.doi.org/10.17159/2411-9717/1387/2021 [ Links ]
Watson, B.P., Ryder, J.A., Kataka, M.O., Kuijpers, J.S., and Leteane, F.P. 2008. Merensky pillar strength formulae based on back analysis of pillar failures at Impala Platinum. Journal of the Southern African Institute of Mining and Metallurgy, vol. 108, no. 8, pp. 449-461. [ Links ]
York, G., Canbulat, I. 1998. The scale effect, critical rock mass strength and pillar system design. Journal of the Southern African Institute of Mining and Metallurgy, vol. 98, no. 1, pp 23-37. http://dx.doi.org/0038-223X/3.00/0.00 [ Links ]
Zipf, R.K. 2001. Toward pillar design to prevent collapse in room-and-pillar mines. 108th Annual Exhibit and Meeting, Society for Mining, Metallurgy and Exploration, Denver. [ Links ]
 Correspondence:
B.P. Watson
Email: bryan.watson@wits.ac.za
Received: 25 Apr. 2024
Revised: 9 Aug. 2024
Accepted: 12 Sept. 2024
Published: November 2024