


Services on Demand
Journal

Article
 English (pdf)
 Article in xml format
 Article references
 Send this article by e-mail
Indicators
Related links
-
 Cited by Google
 -
 Similars in Google
Share

 Permalink
Journal of the Southern African Institute of Mining and Metallurgy
On-line version ISSN 2411-9717Print version ISSN 2225-6253
J. S. Afr. Inst. Min. Metall. vol.125 n.2 Johannesburg Feb. 2025
https://doi.org/10.17159/2411-9717/3376/2025
PROFESSIONAL TECHNICAL AND SCIENTIFIC PAPERS
Simulation of kinetic joint forces in a nutating grinding mill
J.J. van TonderI; J.R. BredellI; C. CoetzeeI; J. BranehogII
IDepartment of Mechanical and Mechatronic Engineering, Stellenbosch Univeristy, South Africa. ORCiD: J.J. van Tonder https://orcid.org/0009-0009-6290-2978; ORCiD: J.R. Bredell https://orcid.org/0000-0002-0748-746X; ORCiD: C. Coetzee https://orcid.org/0000-0002-9924-8123
IIDe Beers Group, South Africa. ORCiD: J. Branehog https://orcid.org/0009-0001-5625-8989
ABSTRACT
A nutating grinding mill, exemplified by the commercial HICOM mill, achieves efficient particle size reduction through the accelerated motion of the material charge within the nutating chamber. This design, characterised by high particle velocities and rapid charge circulation, offers a compact solution compared to tumbling mills. There have been concerns regarding the mechanical reliability of kinetic joints for certain specialised mining applications. Recognising the need to model internal forces in such systems, this study focuses on the uncoupled simulation using multibody dynamics and the discrete element method. The investigation employed a small-scale experimental test mill, referred to as the NuMILL, featuring a cylindrical chamber (140 mm internal diameter, 245 mm height, 6° nutation angle). Instrumented with an array of sensors, the NuMILL provided internal load data for validating the simulations. Experiments were conducted with an empty chamber or filled with charge material. Charge materials included coarse sand or steel pellets with a charge-to-chamber mass ratio of 0.25. The mill speed ranged between 100 to 700 RPM. Multibody dynamics modelled resultant inertial and frictional loads within 5%, while the discrete element method simulated the internal material contact loads with accuracies ranging from 1% to 19%. The combined simulation approach predicted the resultant forces in the critical kinetic joint within a 20% margin. Representing the charge using rigid lumped mass elements was also studied. The presented simulation techniques, validated against experimental data, offer a robust foundation for analysing larger systems, including the industrial-scale HICOM.
Keywords: HICOM, nutating grinding mill, multibody dynamics, discrete element method
Introduction
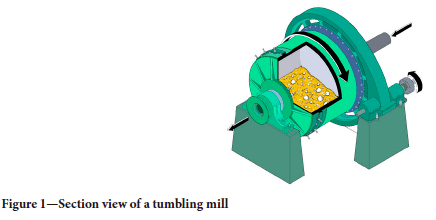
Grinding is a particle size reduction process involving abrasion and impact forces, typically occurring in a rotating cylindrical chamber filled with screened mined material, termed the charge (Wills and Finch, 2016). Figure 1 illustrates a common grinding machine referred to as a tumbling mill. Figure 2 depicts various charge tumbling regimes, dependent on chamber rotation speed, gravitational acceleration, and internal diameter.
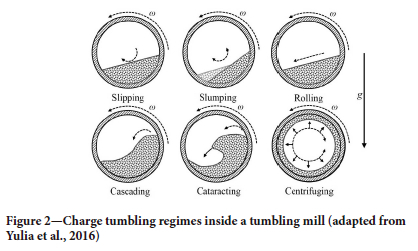
The cataracting regime proves most effective for grinding in a mill (Yulia et al., 2016), as it is characterised by high material impact and compression loads. However, achieving this regime requires a fine balance, since a slight increase in rotation speed beyond the optimum leads to centrifuging, resulting in significantly reduced grinding efficiency. To increase material throughput, large diameter mills are often required. However, practical limitations in operations with spatial constraints may prevent enlarging the mill diameter.
An alternative is the centrifugal mill (Bradley et al., 1974). A centrifugal mill includes multiple slender mill tubes, which contain the charge and rotate about their own axes. In addition to the own-axis rotation, the tubes also rotate about a centred primary axis, which is parallel to the mill tube axes. The drive mechanism is typically achieved using a planetary gear train. The primary axis is vertical with the feed-end located at the top and discharge-end located at the bottom to enable continuous throughput. This dual-axes rotation creates intense acceleration fields and charge motion conducive to grinding (Hoyer and Lee, 1997). Compared to a conventional horizontal tumbling mill of equivalent size, a centrifugal mill achieves superior material breakage rate and operating throughput. Liner wear has been identified as a drawback of such systems.
Nutating mills advance the idea of tumbling a charge within an induced centrifugal acceleration field through nutating motion (Nesbit and Moys, 1998). An example of such a nutating grinding mill is the HICOM, depicted in Figure 3. The HICOM's nutating movement resembles the dynamic motion of swirling a conical flask by the wrist, featuring rapid circular oscillations inducing varying centrifugal acceleration fields (Nesbit et al., 2001). These acceleration fields can achieve material breakage rates 50 to 100 times greater than conventional tumbling mills per unit volume (Hoyer, 1999).
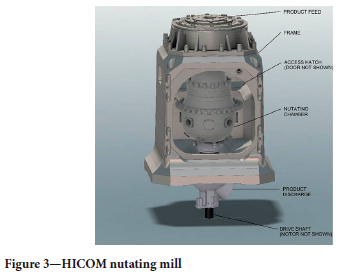
The HICOM's appeal lies in its reduced chamber size, high acceleration fields, and rapid comminution rates. Although widely used in industry for stated reasons, shortcomings relating to mechanical reliability have been found for specific mining applications. Sensitivity to dimensional tolerances and load path characterisation are thought to be potential root causes, which may lead to bearing and component fatigue failure.
The cost, size, and availability of commercial machines often prohibit research using full-scale physical measurements. Simulation offers a more practical method to analyse grinding equipment and conduct virtual experiments.
Research aim and methodology
This research aims to develop a verified simulation method for a generalised nutating mill to accurately predict the dynamic forces at selected kinetic joints. The simulations are based on the combination of multibody dynamics (MBD) and discrete element method (DEM) analyses. To facilitate this research, a small-scale laboratory model of a nutating mill, inspired by HICOM but with simplified component geometries, was designed and manufactured. This small-scale nutating mill will be referred to as the NuMILL. The NuMILL provided the experimental data necessary for validating the simulations and studying the internal forces and material motion. The insights gained from the experimental and simulated NuMILL analyses will aid in identifying which kinetic joint within the HICOM is subjected to the highest loads. Deeper understanding of the critical load paths and quantification of operational loads at kinetic joints can inform design decisions and operating practices. This in turn, will reduce the risk of component failure and improve system availability.
Experiments
Figure 4 provides a cross-sectional view of the NuMILL CAD model, along with a photo of the fully assembled NuMILL with reference dimensions. The NuMILL serves as a kinetic equivalent laboratory model of the HICOM, playing a pivotal role in experimentally validating simulations. Its primary objective is to measure kinetic joint loads at critical locations, including the nutation point and torque arm crankpin. A more detailed description of the load paths and constraints, accompanied by a free body diagram of the nutating chamber, are presented in the following section covering the simulations. It is also capable of capturing video footage of the material motion within the grinding chamber.
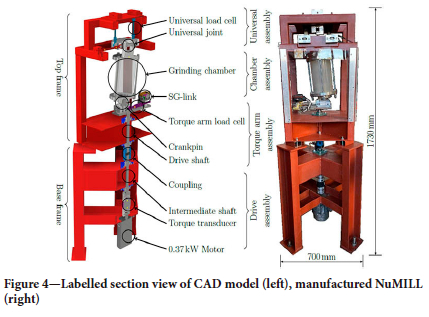
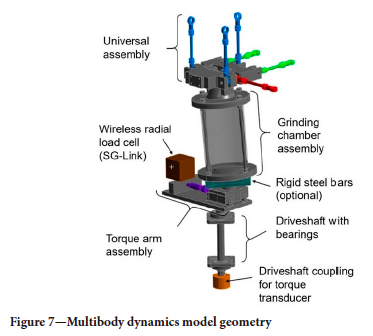
The universal joint assembly, designed to serve as a force balance, incorporates load cells for measurement of forces and moments at the nutation point. The assembly is shown in Figure 4 and Figure 7. It is composed of a solid aluminium stationary yoke (196 mm × 216 mm × 40 mm) that interfaces with load cells, the universal cross-element, and an oscillating yoke connected into the top of the grinding chamber.
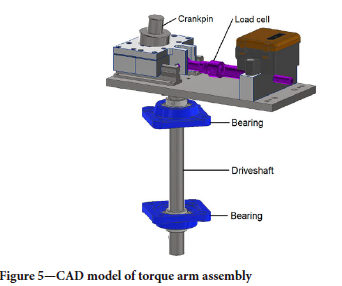

The rotating torque arm supports the eccentrically rotating crankpin, which in turn interfaces with the bottom of the chamber via a spherical bearing. The bearing was designed with axial float to avoid an over constrained and statically indeterminate system. The crankpin is mounted on radial guide rails and is connected to a wireless load cell (SG-link), allowing the measurement of the radial force acting on the crankpin. Detail of the torque arm assembly is shown in Figure 5.
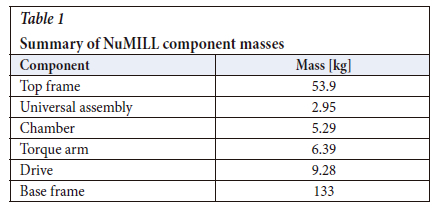
The base frame houses the drivetrain, which includes the driveshafts, associated bearings, a 0.37 kW motor, and a torque transducer for measuring torque and inferring tangential loads on the crankpin. Masses of NuMILL components and assemblies are detailed in Table 1.
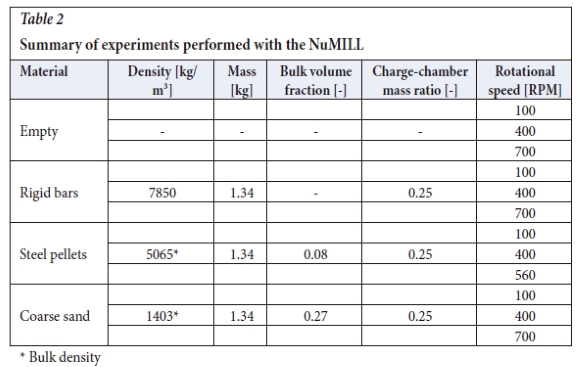
The experiments conducted using the NuMILL involved varying the rotational speed of the motor and the type of charge material inside the chamber. Photos of the different charge materials are shown in Figure 6. It is noted that Figure 6 displays plastic pellets not discussed in this article; the relevant materials are the coarse silica sand (dry) 3 mm to 5 mm grain size, 5 mm diameter steel pellets and rigid steel bars. The steel pellets and sand were chosen to reduce modelling uncertainty, since they have been well-characterised in previous work (Coetzee and Katterfeld, 2023a). All the rotation speed profiles had the same constant rotational acceleration followed by a constant rotation speed of either 100, 400, or 700 RPM (except for the steel pellets, where the power limit of the motor was reached at 560 RPM). The constant rotational speed was maintained for at least 30 seconds before power to the motor was cut allowing free rotation until the chamber came to rest. Once the target speed was reached, the transient response in the experimental torque and force data was not significant and a steady state condition was reached shortly after the acceleration ramp. Steady state data for which the torque and forces amplitudes remained constant were selected for further processing. The dependent variables included kinetic joint forces, driveshaft torque, and charge motion. Only steady state results at different rotation speeds are presented. Table 2 summarises the NuMILL experiments discussed in this work.
The experiments adhered to the following procedure: For the empty case, no charge material or steel bars were used. The steel bars were rigidly mounted on the outside face of the chamber base for the case where the charge is represented by lumped mass. For the steel pellet and sand cases, the chamber was filled with charge masses listed in Table 2. Subsequently, the NuMILL was accelerated to a constant rotational speed required for testing and maintained at that speed throughout the test. To account for statistical variation in measurements, each test point was repeated three times, allowing for the averaging of measurement data. Only mean results are reported here.
Two distinct types of experiments were conducted. The first focused on load cell measurements of joint forces, while the second involved the video recording of the particle motion relative to the chamber. For the latter, additional structural supports for the camera assembly were introduced into the chamber. This addition altered the inertial loads of the nutating chamber due to the added mass. Consequently, no force data were recorded during the video recording experiments. Given the high degree of rigidity of the support frames and chamber, the particle motion is not expected to be influenced by the additional mass of the camara and frame, since the only additional displacements would be the elastic deformation of metal components. This enabled visual comparison of the particle motion between the experimental video footage and DEM simulations. The force data of the experiments conducted without the camera, however, served the purpose of validating the modelled force response from MBD and DEM simulations.
Simulations
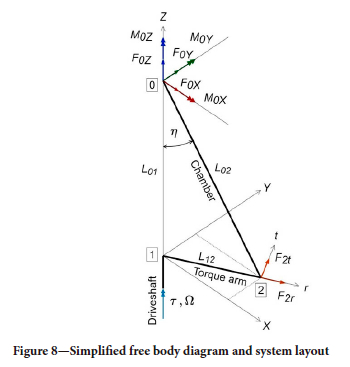
The MBD model, developed in ANSYS Mechanical simulation software (ANSYS, 2022), is depicted in Figure 7 and Figure 8. Figure 7 shows the modelled components, highlighting key elements such as the six load cells in the universal assembly, the radial load cell (purple) in the torque arm assembly, and the transparent grinding chamber. Figure 8 shows a simplified free body diagram with kinetic parameters and system layout. Points 0, 1, and 2 refer to the nutation point inside the universal assembly, torque arm rotation point and crankpin position, respectively. The torque arm rotation axis corresponds to the global Z-axis, and the local chamber axis coincides with the line between points 0 and 2. The local radial and tangential axes at the crankpin are shown at point 2. The linear distance between points 0 and 1, and between points 1 and 2, are given by L01 (366 mm) and L12 (39 mm), respectively. The universal assembly is connected to the top frame using six rods with spherical rod ends. Three of the rods are aligned with the vertically z-axis, two with the y-axis, and one with the x-axis, as shown in Figure 7. This arrangement rigidly supports the stationary yoke. The cross-element and oscillating yoke are free to rotate about their respective axes. In the experiments, loads cells were fitted to certain rods to enable the measurement of the reaction forces and moments at the nutation point. The chamber is supported at point 0 using two cylindrical joints in the X- and Y-axes, representing the universal joint. In addition, a cylindrical joint is defined between the torque arm and the chamber at point 2, where the radial and tangential crankpin loads are calculated. The torque arm is rigidly connected to the driveshaft, which rotates with prescribed speed Ω), and the driveshaft torque (τ) is calculated. A friction coefficient of 0.03 was used at all kinetic joints to account for frictional losses in the system. The friction coefficient was obtained through a calibration process where the value was tuned in the simulation to match the experimental steady state torque for an empty chamber rotating at 400 RPM.
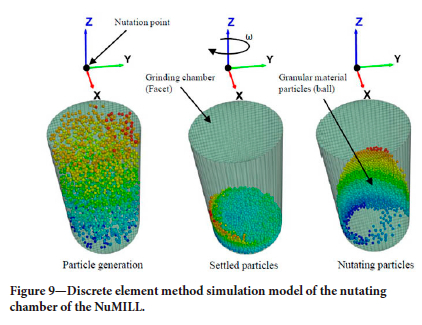
The DEM simulations were performed using PFC3D simulation software (ITASCA, 2023), based on the dimensions and force decomposition described in Figure 8. The DEM model, which refers to the massless facet walls, DEM particles, coordinate system, constraints, and torque arm rotation speed ω) is shown in Figure 9. To enable comparison to experimental steady state data, simulations were run for a long enough period to ensure steady state conditions in terms of reaction forces.
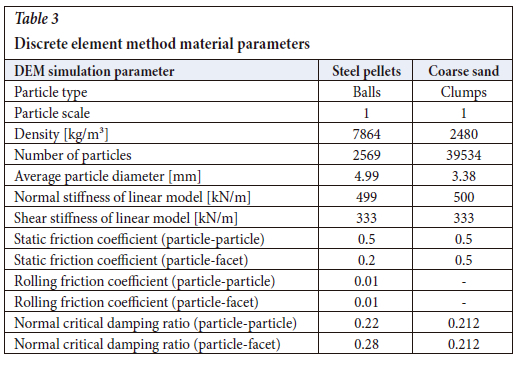
The simulated charge materials included 5 mm steel pellets and coarse sand. The steel pellet simulation was previously validated (Van Tonder, 2024), utilising literature data (Bian et al., 2017) and factorial analysis to determine parameter sensitivity. Calibration and validation work by Scheffer and Coetzee (2023a) and Scheffer and Coetzee (2023b), provided the foundation for modelling the coarse sand charge. In this research, magnified images of sand particles were used to characterise particle geometries and associated properties. Material parameters such as bulk density, normal stiffness, and shear stiffness, were experimentally determined. A linear contact model was used in both the steel particle and sand simulations (Coetzee and Katterfeld, 2023). Table 3 summarises the finalised DEM material parameters for both steel and sand simulations.
Both the coarse sand and steel pellet simulations where 1:1 scaled simulations of the experiments performed on the NuMILL. Apart from the material parameters, another modelling difference was that the steel pellet simulation made use of ball elements and the sand was modelled using clump elements. The modelled sand clump geometries were based on scanned geometrical data of ten different sand grains. Each of the grain geometry types were represented with a clump consisting of three spherical particles.
The sizes and positions of the spherical particles in a clump were optimised to represent the associated scanned geometry. In addition, an experimentally determined size distribution was applied to each clump type. Details of the clump geometries and size distribution are reported in Scheffer and Coetzee (2023a).
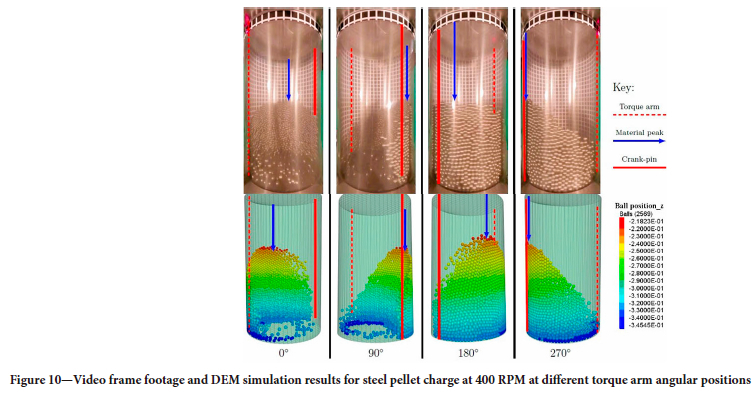
Examples of the video footage from the camera attached to the nutating chamber are shown in Figure 10. The figure shows the steel pellet charge at various angular positions for a rotation speed of 400 RPM for visual comparison with DEM results. The fringe scale in the DEM results indicate the vertical (Z-coordinate) particle position relative to the origin located at the nutation point. Detailed analysis of video footage is covered by Van Tonder (2024), which includes a sensitivity analysis of the particle-to-particle and the particle-to-facet friction coefficients. These properties were found to significantly influence the shape of the charge. The primary purpose of the recorded video (240 frames per second) was for qualitative visual comparison of particle distribution. Approximate measurements of the material crest height and phase lag were taken using 10 mm (tangential) by 10 mm (axial) grid paper adhered to the outside face of the transparent cylindrical section of the chamber. This method relied on the visual estimation of particle positions in a video frame corresponding to the approximate chamber angular position of interest. Significant uncertainty can therefore be expected in terms of measurement resolution and repeatability. Despite these limitations, the sensitivity analysis of material friction properties showed reasonably good qualitative comparison between simulation and experiment. However, since the purpose of the current research was to calculate internal component forces, load cell measurements were used as the primary validation metric.
Results and discussion
This section presents results of the uncoupled MBD and DEM simulations and subsequently, compares the results to experimental measurements. Several key points are highlighted to assist with the interpretation of the results, as well as to provide context and motivation for selected results presented here.
Firstly, the results are plotted against a non-dimensional centrifugal acceleration parameter (λ) on the primary x-axis of the graphs. During the preliminary analysis of experimental data, it was observed that the force data exhibited a more linear relationship with λ, compared to the rotation speed (Ω). However, for a more intuitive reference, the rotation speed in RPM is shown on the non-linear secondary x-axis.
The non-dimensional centrifugal acceleration parameter (λ) is defined as,
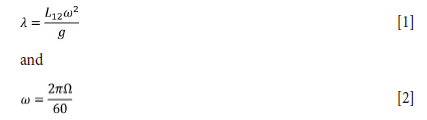
where ω is the rotation speed in rad/s, Ω is the rotation speed in RPM, L12 is a linear dimension shown in Figure 8, and g is gravitational acceleration in m/s2.
Secondly, the MBD simulations include the frictional and inertial loads of the empty nutating mill, while the DEM results account for the material contact loads acting on the chamber walls. To compare measured experimental forces to calculated DEM results for a specific material, forces for the empty nutating chamber at the corresponding speed must be subtracted from the experimental data, which included charge material. In so doing, the material loads are isolated and represent the contact loads that are modelled using DEM.
Thirdly, when MBD and DEM simulations are superimposed, they become comparable with experimental values since the results will include inertial, frictional, and material effects. In the presented graphs the combined simulation results are indicated as (MBD+DEM).
Moreover, the magnitude of the forces acting on the crankpin via the spherical bearing was found to be significantly higher than at the universal assembly (Van Tonder, 2024). Anecdotal evidence of field failures also identifies the bottom of the chamber as a critical location in industrial systems. Furthermore, the influence of the material contact loads on the drive shaft torque (and therefore power) was a particularly interesting aspect of the research. For these reasons, the reported results will focus on the forces at the crankpin and the torque in the drive shaft.
The MBD simulation for an empty chamber rotating at 100, 400, and 700 RPM is compared to experimental results for the same load cases and summarised in Table 4. Percentage differences, considering experimental values as the reference, reveal the highest difference for radial force is 6%, tangential is >20% and the resultant force, i.e., the vector sum of radial and tangential forces, is 5%, all at a speed of 100 RPM. The notable difference for the tangential force is attributed to the empty system's small torque magnitudes, magnifying any slight deviation and measurement error at low speeds and force values. It is observed that for steady state operation the tangential force component is <1% for the radial force component and therefore insignificant. Higher tangential forces can however be expected during startup or shutdown due to angular acceleration. Nevertheless, it is noteworthy that the resultant load, representing the resultant force acting on the crankpin, is simulated with good accuracy across all rotational velocities, with the highest error being 5%.
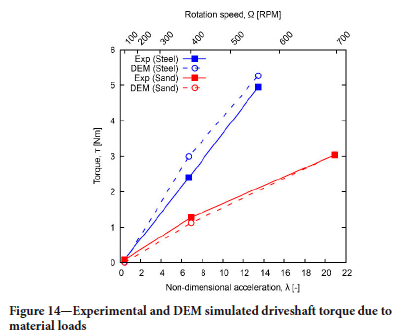
The radial, tangential, and resultant crankpin forces due to material interaction are shown in Figure 11, Figure 12 and Figure 13, respectively. The corresponding driveshaft torque is plotted in Figure 14. In these figures, favourable correlation between experimental and simulated results is observed for both sand and steel pellet charges. Notable observations include the most significant deviations in radial force occurring at 560 RPM for steel and 400 RPM for sand. Similarly, tangential and torque loads exhibit their highest deviations at 400 RPM for both charge types.
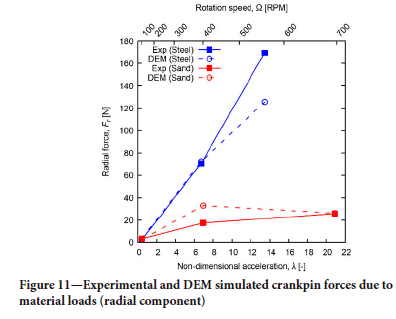
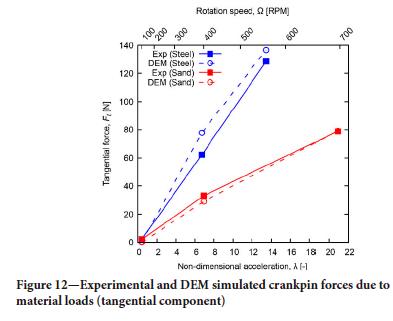
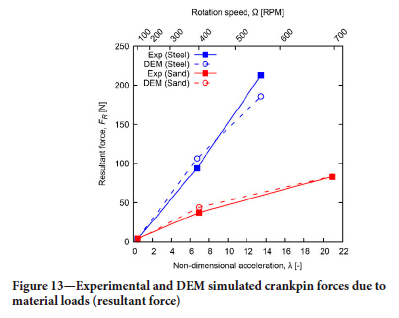
Analysing the resultant force on the crankpin reveals speed-dependent deviations for the steel charge of 7.8%, 12.7%, and 12.6% at 100, 400, and 560 RPM, respectively. For the sand charge, the speed-dependent deviation is 29.8%, 17.9%, and 0.4% at 100, 400, and 700 RPM, respectively. Importantly, for all simulation test points for both sand and steel simulations, the error is below 20% (except for sand at 100 RPM, where the error is 29.8%), aligning with the criteria set by Scheffer and Coetzee (2023a) for considering particle flow simulations as being accurate.
The superimposed results from DEM and MBD simulations in comparison to the equivalent experimental measurements are presented in Figure 15 and Figure 16. Notably, torque, radial, and tangential crankpin loads exhibit a strong correlation with experimental values, particularly evident when evaluating resultant crankpin forces.
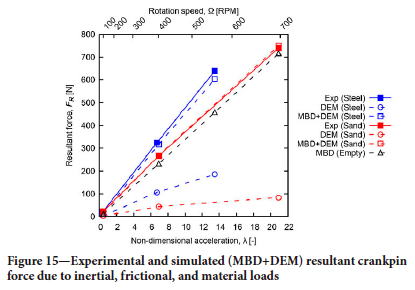
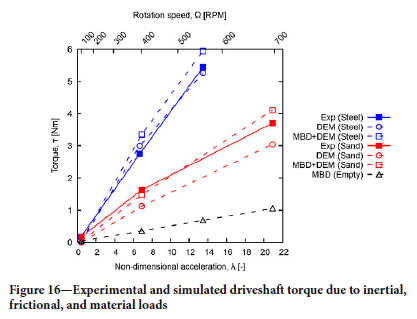
Analysing the resultant force on the crankpin reveals speed-dependent deviations for the steel charge of 19%, 6%, and 1% at 100, 400, and 560 RPM, respectively. For the sand charge, the deviations are found to be 36%, 1%, and 1% at 100, 400, and 700 RPM, respectively. As mentioned earlier, any error value below 20% is considered accurate.
The combined DEM and MBD simulations are reasonably accurate, except for sand at 100 RPM. This discrepancy can potentially be attributed to measurement error, especially given the small torque and radial force magnitudes, where the influence of transducer sensitivity and external effects, such as friction, are likely significant.
The DEM material parameters were adapted from research by Scheffer and Coetzee (2023a), who performed thorough characterisation of the specific coarse sand used in the experiments. The DEM parameters were applied to the NuMILL simulation model without extensive parameter iteration or simulation calibration, potentially contributing to the observed simulation error at 100 RPM. Despite this, the very low simulation errors at 400 and 700 RPM demonstrate that the characterisation done using a linear contact model, was effective. This suggests that with thorough material characterisation, simulations may achieve sufficient accuracy with minimal additional calibration.
Moreover, an observation from this evaluation is that the charge material does not equally influence torque and radial loads. In the case of radial load, the force resulting from charge contact force (DEM) contributes less to the overall experimental measurement compared to the contribution of the inertial and frictional loads of the rotating structure (MBD). However, for driveshaft torque, the contribution of material loads (DEM) is far more significant than inertial and friction loads (MBD) under constant speed operation.
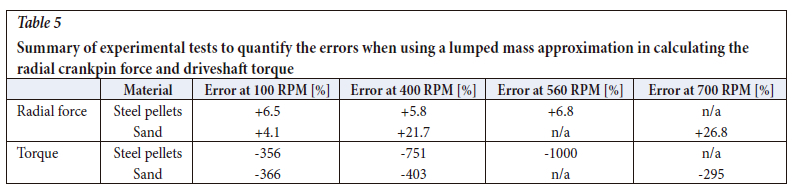
Furthermore, it is evident that identical charge masses, such as steel and sand, exhibit notable differences in resultant force and torque responses. The steel demonstrates a significantly higher resultant response compared to sand, i.e., 22% greater radial load and a 56% greater torque at 560 RPM. This difference is further magnified when equivalent rigid lumped masses replace the material charge. Table 5 presents results of an experimental investigation on the error incurred by representing the charge as a lumped mass (equal to the mass of the charge), neglecting all other material properties and charge motion. In general, it is shown that the lumped mass approximation overpredicts the radial force (indicated by '+'), and underpredicts the torque (indicated by '-').
For the crankpin radial load, a lumped mass approximation is relatively accurate, with the highest error of 26.8% occurring at 700 RPM. However, significant inaccuracies are shown in the torque values, with the highest error reaching 1,000% for steel pellets at 560 RPM. Despite torque loads being of a lower scale than the radial component, the derived mill power is influenced by torque, introducing substantial error that can negatively impact mill operation and reliability. This underscores the limitations of lumped mass approximations and the necessity to include material load effects in simulations.
Conclusion
A nutating mill achieves particle size reduction by accelerating the charge inside a nutating chamber inducing high impact and abrasion forces. The mechanical design of the system requires an understanding of the complex internal loads. The critical region in terms of load magnitude was identified as the load transfer mechanism between the torque arm and chamber via the crankpin, which formed the focus of this investigation.
Two simulation techniques, namely multibody dynamics (MBD) and discrete element method (DEM), were used to model the kinetic joint forces of a small-scale experimental mill (NuMILL) for various charge materials and rotation speeds. The MBD models inertial and frictional loads of the moving structure, whereas the DEM models the material motion and calculates the contact forces acting on the grinding chamber. Crankpin forces from these uncoupled simulations are combined and compared with experimental measurements.
Simulated resultant crankpin forces showed errors of 19%, 6%, and 1% at 100, 400, and 560 RPM, respectively, for the steel pellet charge, and errors of 36%, 1%, and 1% at 100, 400, and 700 RPM, respectively, for the coarse sand charge. Presented simulation techniques can be used to analyse full-scale systems. Calculated forces at the kinetic joints can be used in detailed structural design, bearing selection and fatigue analysis. For these purposes the accuracies of the simulations are deemed sufficiently accurate.
Further experimental tests were performed to quantify the difference in force magnitude when using lumped masses to represent the moving charge inside the nutating chamber. The outcome of these tests indicated that the lumped mass assumption provides conservative estimates for radial crankpin loads but significantly underestimates the driveshaft torque. This underscores the necessity for accounting for charge material loads where the prediction of driveshaft torque and power is of interest.
The current investigation was limited to an essentially rigid support structure and dry homogeneous charge materials. Future work aims to explore the inclusion of flexible mountings and modelling of the transient dynamic response using coupled simulation methods and wet charge materials. The modelling of material breakage and non-autogenous grinding may also be investigated. In the presented work video footage and approximate visual measurements were used for qualitative validation of simulated particles distributions. Computer vision techniques can be explored to improve the measurement resolution and repeatability of this method.
Credit author statement
JJvT: Investigation, validation, formal analysis, writing, visualisation.
JRB: Conceptualisation, methodology, writing, supervision.
CJC: Conceptualisation, methodology, writing, supervision. JB: Conceptualisation, methodology.
References
Ansys®. 2022. Academic Research Mechanical - User's Guide [ Links ]
Bian, X., Wang, G., Wang, H., Wang, S., Lv, W. 2017. Effect of lifters and mill speed on particle behaviour, torque, and power consumption of a tumbling ball mill: Experimental study and DEM simulation. Minerals Engineering, vol. 105, pp. 22-35. [ Links ]
Bradley, A.A., Freemantle, A.J., Lloyd, P.J.D. 1974. Developments in centrifugal milling. Journal of the South African Institute of Mining and Metallurgy, vol. 11, pp. 379-387. [ Links ]
Coetzee, C., Katterfeld, A. 2023 April. Calibration of DEM Parameters. In: McGlinchey, D. (ed.), Simulations in Bulk Solids Handling, 1st ed, pp. 1-40. Wiley. [ Links ]
Hoyer, D., Lee, D. 1997. High-intensity autogenous liberation of diamonds from kimberlite in the HICOM mill. Minerals Engineering, vol. 10, no. 3, pp. 265-273. [ Links ]
Hoyer, D.I. 1999. The discrete element method for fine grinding scale-up in HICOM mills. Powder Technology, vol. 105, no. 1-3, pp. 250-256. [ Links ]
ITASCA®. 2023. PFC 6.0 User's Guide. https://docs.itascacg.com/pfc600/pfc/docproject/index.html [accessed 5 March 2024]. [ Links ]
Nesbit, P., Moys, M. 1998. Load behaviour in the HICOM nutating mill. Minerals Engineering, vol. 11, no. 10, pp. 979-988. [ Links ]
Nesbit, P., Du Toit, G., Mapasa, K., Feldman, C. 2001. Evaluation of the HICOM 120 mill at Venetia mine. Minerals Engineering, vol. 14, no. 7, pp. 711-721. [ Links ]
Owen, P., Cleary, P.W. 2016. Understanding performance variation of a HICOM mill with operating conditions and media attributes. International Journal of Mineral Processing, vol. 155, pp. 13-31. [ Links ]
Scheffler, O.C., Coetzee, C. 2023a. DEM calibration for simulating bulk cohesive materials. Computers and Geotechnics, vol. 161, 105476. https://doi.org/10.1016/ixorrrpgeo.2023.105476 [ Links ]
Scheffler, O.C., Coetzee, C. 2023b. Discrete element modelling of a bulk cohesive material discharging from a conveyor Belt onto an impact plate. Minerals, vol. 13, 1501. https://doi.org/10.3390/min13121501 [ Links ]
Van Tonder, J.J. 2024. Experimental testing and simulation of a nutating grinding mill. Master's thesis, Stellenbosch University, South Africa. [ Links ]
Wills, B.A., Finch, J.A. 2016. Wills' Mineral Processing Technology: An Introduction to the Practical Aspects of Ore Treatment and Mineral Recovery. 8th ed. Elsevier/Butterworth-Heinemann, Amsterdam. [ Links ]
Yulia, Mardiansyah, Y., Khotimah, S.N., Suprijadi, Viridi, S. 2016. Characterization of motion modes of pseudo-two-dimensional granular materials in a vertical rotating drum. 6th Asian Physics Symposium - Journal of Physics: Conference Series, vol. 739, 012148. https://doi.org/-10.1088/1742-6596/739/1/012148 [ Links ]
 Correspondence:
J.R. Bredell
Email: jrbredell@sun.ac.za
Received: 16 Apr. 2024
Revised: 5 Nov. 2024
Accepted: 10 Dec. 2024
Published: February 2025
