


Services on Demand
Journal

Article
 English (pdf)
 Article in xml format
 Article references
 Send this article by e-mail
Indicators
Related links
-
 Cited by Google
 -
 Similars in Google
Share

 Permalink
Journal of the Southern African Institute of Mining and Metallurgy
On-line version ISSN 2411-9717Print version ISSN 2225-6253
J. S. Afr. Inst. Min. Metall. vol.125 n.7 Johannesburg Jul. 2025
https://doi.org/10.17159/2411-9717/3166/2025
PROFESSIONAL TECHNICAL AND SCIENTIFIC PAPERS
Light detection and ranging-based georeferencing of underground mining ground-penetrating radar data
T. KgarumeI; M. van SchoorI; M. MpofuI; H. GroblerII
IMining Technical Solutions, CSIR, South Africa. ORCiD: T. Kgarume: http://orcid.org/0009-0001-2523-2196; M. van Schoor: http://orcid.org/0000-0003-2177-5967; M. Mpofu: http://orcid.org/0000-0003-2010-7596
IIMining Engineering and Mine Surveying, University of Johannesburg, South Africa. http://orcid.org/0000-0002-4729-5753
ABSTRACT
The South African mining industry has committed to achieving a state of zero harm for its workforce, with a strong emphasis on worker health and safety. Among the major safety concerns are falls of ground, a leading cause of injuries and fatalities. Ground-penetrating radar, a non-destructive geophysical method, is recognised for its ability to image structures, fractures, and geological features within the rock mass. However, ground penetrating radar data is often acquired in local coordinates, posing challenges for visualisation in mine computer-aided design or three-dimensional visualisation software. This study explores the pivotal role of light detection and ranging data in transforming ground penetrating radar data from local survey coordinates to absolute mine coordinates. A comprehensive georeferencing methodology is presented, providing the stepwise progression from the initial georeferencing of ground penetrating radar data to the ultimate integration of ground penetrating radar and light detection and ranging datasets, resulting in the creation of a ground penetrating radar-light detection and ranging three-dimensional model. The proposed approach not only facilitates the integration of but also offers a practical means of visualising the integrated datasets within commonly used computer-aided design or three-dimensional visualisation software. An essential aspect of this integration is the adoption of non-proprietary data formats, specifically American Standard Code for Information Interchange text files, ensuring broader accessibility and compatibility. The potential for integrating diverse datasets to construct insightful models of the underground mining environment is illustrated. Integration of different datasets has the potential to offer a holistic understanding of the mining environment, providing essential information to decision-makers.
Keywords: georeferencing, light detection and ranging (LiDAR), ground penetrating radar (GPR), data integration, visualisation, health and safety
Introduction
The South African mining sector is dedicatedly striving to attain a state of zero-harm for its workforce, focusing particularly on the health and safety of its workers. To effectively comprehend the risks associated with falls-of-ground (FOG), it is essential to gain deeper insights into excavation stability through the utilisation of various technologies. In 2015, the South African Mining Extraction Research, Development, and Innovation (SAMERDI) strategy was formally adopted and served as an input document to the government-driven Mining Phakisa initiative that was held in November 2015 (Singh, 2017). SAMERDI has a primary focus on achieving three main objectives: zero harm, increased operational efficiency, and reduced costs within the mining sector. One of the critical areas of emphasis identified within SAMERDI is the Advanced Orebody Knowledge (AOK) programme, which is aimed at providing mine planners, rock engineers, geologists, and other decision-makers with valuable information and knowledge that is intended to contribute to the overarching objectives of achieving both optimal extraction and zero harm within the mining operation (Mandela Mining Precinct, 2023). The AOK programme aligns with SAMERDI's zero harm objective by conducting research into technologies capable of delineating the orebody and associated geological disturbances. This research aims to provide a deeper understanding of the rock mass and to assist in mine planning and the design of rock engineering solutions. Geophysics has previously played a pivotal role in the mining industry, primarily in secondary exploration and surveying. Its application has been instrumental in gaining insights into the stability of the rock mass within areas of geological, mining, and rock engineering disciplines. Amongst the technologies that have garnered attention for understanding the rock mass stability by imaging structures, fractures, domes, potholes, and similar features, is ground penetrating radar (GPR), a non-destructive geophysical method. The local mining industry has previously leveraged GPR technology. In recent years, GPR has been used in underground mining for mapping geological discontinuities (such as parting planes, faults, dome, potholes, dykes, and fractures) and imaging of orebodies within the rock mass surrounding the mining excavations (White et al., 1999; Van Schoor et al., 2006; Vogt et al., 2005). Grodner, (2001) used GPR to quantify changes in the fracture pattern resulting from preconditioning ahead of a mining face in a deep-level Witwatersrand Basin gold mine. An in-depth discussion of its historical applications is discussed by Kgarume et al. (2019).
GPR data is obtained by moving a transmitter and receiver antenna along the surface of the rock mass to produce output results/images, which are subsequently analysed to gain insights into structures that could potentially compromise the stability of the rock mass. Typically, these results are acquired in local coordinates, which correspond to the coordinates relative to some arbitrary reference point specified for the surveyed area. Consequently, these results are not inherently linked to the mine's underground coordinate system, making it challenging to visualise and interpret the data in the mine's computer-aided design (CAD) software or other three-dimensional (3-D) visualisation software. To overcome this, light detection and ranging (LiDAR) point cloud datasets, which were collected at the same underground site, were used to georeference the 3-D GPR data. GPR and LiDAR are presently distinct stand-alone technologies, each with its own set of data acquisition and quality control (QC) requirements. Consequently, it becomes important to demonstrate an optimised data acquisition methodology for both scanning technologies and for ultimate integration of both datasets. By georeferencing GPR data with the use of LiDAR point cloud data, it becomes possible to visualise GPR data within CAD and other 3-D visualisation software using the absolute mine coordinate system.
Data acquisition
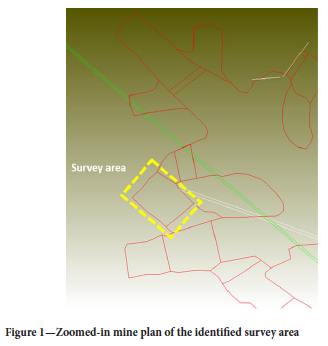
An underground survey area was identified at Royal Bafokeng's Maseve platinum mine. The mine employs the bord and pillar mining method, focusing on the extraction at the Merensky Reef within the Bushveld complex. To access the mining zones, the operation utilises a decline system. Figure 1 shows a zoomed-in mine plan of the surveyed area (yellow box).
Survey area preparation
The primary objective of the survey preparation was to streamline the georeferencing process of the GPR data by harnessing the potential of LiDAR point cloud data. While previous research by Bubeck et al. (2011) successfully integrated GPR and terrestrial LiDAR datasets to create 3-D virtual models of geological outcrops, the unique challenge addressed in this study was not encountered in their work. Their investigations were conducted on the Earth's surface, where access to Global Positioning Systems (GPS) ensured accurate georeferencing of the datasets. In contrast, the underground mining environment presents a distinct challenge due to the absence of GPS signals. To facilitate the georeferencing process, a site visit was conducted for inspection and familiarisation, involving precise measurements of the specified survey area's dimensions. Subsequently, a 3-D GPR survey was designed, covering the hanging wall of the survey area from the back area to the mining face. Survey lines were marked along the hanging wall using spray paint, with reference to four strategically positioned roof bolts (C1, C2, C3, C4) defining the corners of the survey grid, as depicted in Figure 2. This marking strategy ensures precise referencing of the survey line positions and their subsequent identification within the LiDAR point cloud data.
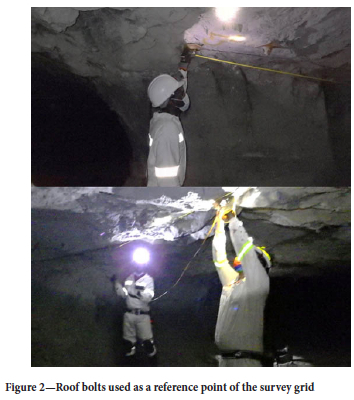
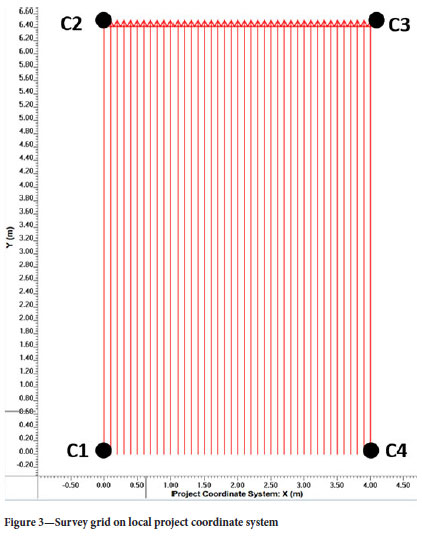
Figure 3 shows the survey grid on the local project coordinate system, where the x-axis corresponds to the spacing between the survey lines, while the y-axis corresponds to the survey line distance. The positions of the roof bolts are indicated by the reference points C1, C2, C3, and C4.
3-D GPR data acquisition
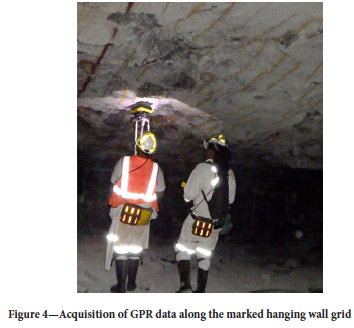
The acquisition of the 3-D GPR dataset was carried out by the team from the Council for Scientific and Industrial Research (CSIR), by following the marked survey layout. This acquisition process entailed the systematic acquisition of parallel GPR survey lines that ran along the surface of the hanging wall. To ensure comprehensive coverage of the survey area, the team maintained consistent intervals between each successive survey line. The GPR data was acquired by using a RockNoggin 1 GHz GPR system, manufactured by Sensors & Software (Sensors & Software, 2023). During data collection along the hanging wall area, a Smart Handle attachment was employed to effectively deploy the GPR antenna along the hanging wall surface, as depicted in Figure 4, ensuring precise data acquisition.
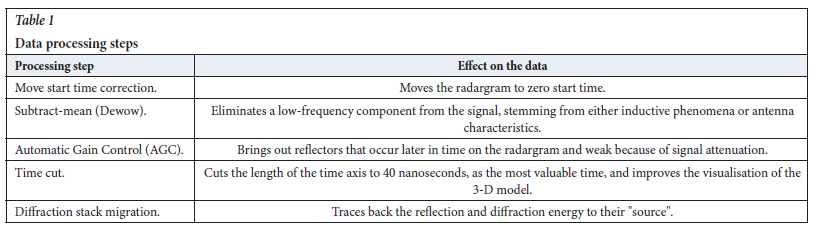
The acquisition of the 3-D GPR survey data followed a systematic approach, starting from one corner of the predefined grid. For example, in Figure 3, the initial profile was acquired, spanning from point C1 to C2. Subsequently, the operator incrementally moved along the x-axis, acquiring consecutive profiles parallel to the first line while maintaining a consistent line spacing of 0.1 metres. This sequential process continued until all the profiles, as illustrated in Figure 4, were successfully acquired. Following the acquisition of data, processing was applied to minimise noise and enhance features, facilitating easier interpretation. Table 1 provides a list of the processing steps applied, along with the description of the effect of each step on the data.
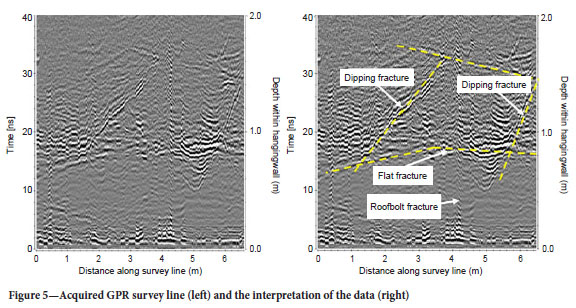
Figure 5 shows one of the survey lines acquired at the site. The x-axis represents the distance along the survey line while the y-axis represents the two-way travel time of the radar pulse (i.e., the time it takes for the radar pulse to travel from the transmitter antenna to a subsurface target and back to the receiver antenna). Using the radio wave speed in rock of 0.1 m/ns, the y-axis is converted to the depth within the hanging wall. The interpreted data demonstrates that GPR can be valuable in identifying structures within the hanging wall that could negatively impact the stability of the rock mass. This, for example, includes detecting scenarios where flat-lying and dipping fractures interact, leading to the potential formation of key blocks within the hanging wall.
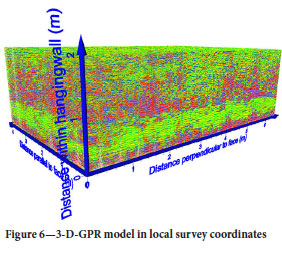
Using these profiles, a 3-D GPR model of the hanging wall was constructed by interpolating between the lines to create a 3-D volumetric data representation. Figure 6 shows the generated 3-D GPR model.
LiDAR data acquisition
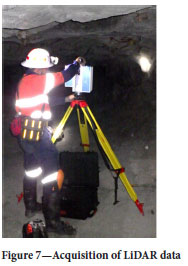
For this task, the team from the University of Johannesburg (UJ) acquired the data using a LiDAR system, as shown in Figure 7. The survey process involved setting up the LiDAR sensor on a tripod and strategically positioning the system at various positions within the survey area. At each position, the LiDAR sensor performed scans of the surroundings, capturing data in all three dimensions.
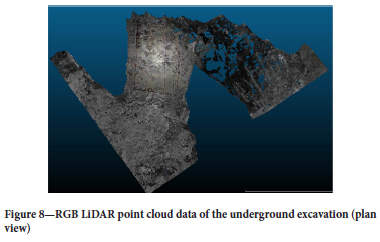
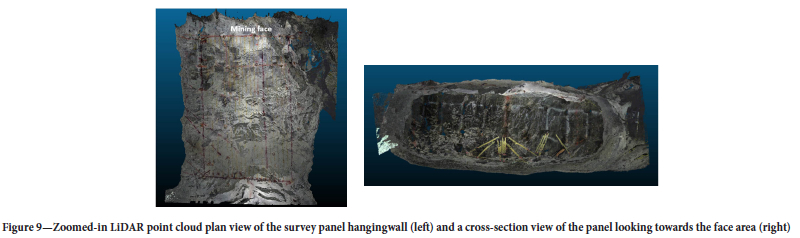
By combining the different scans, it is then possible to create a 3-D point cloud of the survey area. Figure 8 displays the LiDAR point cloud representation of the surveyed underground area, while Figure 9 shows a zoomed-in section of the survey area. The point cloud data is colourised using the red, green and blue (RGB) colour scale. The RGB colour scale contextualises the point cloud as it looks more like a 3-D photograph of the survey area. The survey grid is also visible on the RGB image of the point cloud.
A fundamental aspect of the LiDAR data acquisition process is the inclusion of several "known" control or reference points within the scans. These reference points play a critical role in the subsequent georeferencing of the LiDAR point cloud data. Ideally, the acquisition strategy should encompass a minimum of three known control points, which could consist of surveyed and georeferenced elements like survey pegs or roof bolts. These control points are carefully positioned based on their known and precisely surveyed coordinates relative to nearby survey pegs or other fixed reference points.
Data georeferencing
LiDAR data, similar to GPR data, is initially acquired in a local or relative coordinate system. The crucial link between these local coordinates and the known absolute coordinates of control points forms the basis for converting the relative point cloud coordinates into absolute coordinates, aligned with the mine's coordinate system. By utilising georeferenced LiDAR data, it was possible to determine the absolute coordinates of GPR reference points, such as roof bolts defining the corners of the GPR grid. This information allowed for the extraction of the start and end coordinates of individual GPR lines, facilitating the transformation from the local project coordinate system to the absolute mine coordinate system. For example, the start and end positions of a line in the project coordinate system were updated from XStart = 0, XEnd = 6.5 m to XStart = 9074.5497, XEnd = 9081.0497 for the x-coordinate in the absolute mine coordinate system. Georeferencing was accomplished by employing these start and end coordinates to interpolate the positions of each individual radargram trace and updating the trace header files with this new position information, effectively georeferencing the GPR data. Figure 10 provides a visual representation of the sequential steps involved in achieving this georeferencing process.
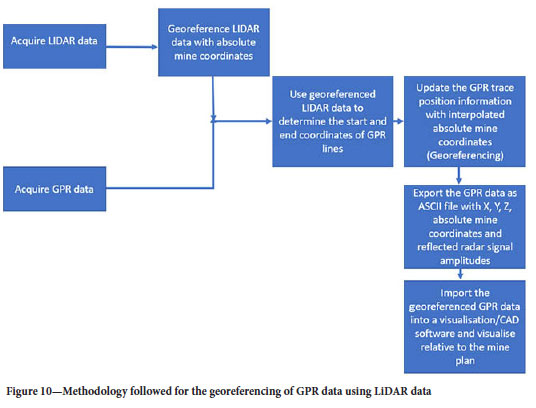
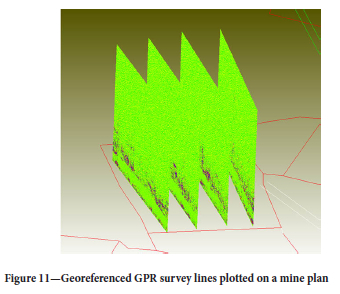
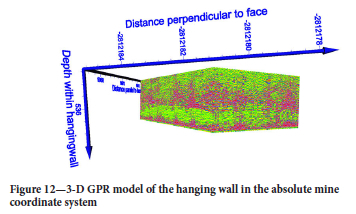
Figure 11 shows selected georeferenced GPR lines plotted on a mine plan of the surveyed panel and Figure 12 shows the 3-D GPR model of the hanging wall in the absolute mine coordinate system.
The successful georeferencing of the GPR lines enabled the integration of the GPR data with the LiDAR point cloud data.
Integration of 3-D GPR with LiDAR point cloud data
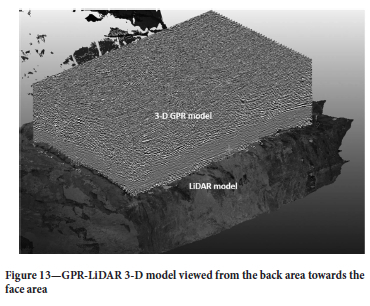
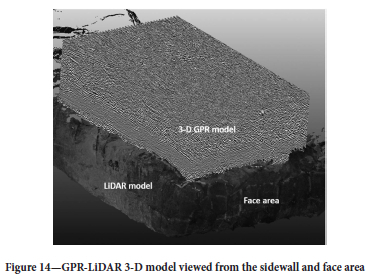
The two datasets were integrated and simultaneously visualised to create a GPR-LiDAR 3-D model of the surveyed site. The visualisation was done in CloudCompare (CloudCompare, 2023), a 3-D point cloud visualisation software. Figure 13 illustrates the resulting GPR-LiDAR 3-D model, which can be rotated and viewed from different perspectives. Additionally, Figure 14 provides an alternative viewpoint, showing the model from the sidewall and face area, offering a detailed representation of the surveyed site. This integration of GPR and LiDAR data enhances the visualisation and understanding of the underground excavation, providing valuable insights for geological and rock engineering analysis.
To enhance the visualisation of the GPR data, the flat fracture identified in Figure 5 was traced along the different radargrams across the 3-D data. This allowed for the visualisation of the fracture as a 3-D surface horizon across the data. Figure 15 shows the surface horizon visualised along with some selected radargrams and the point cloud data.
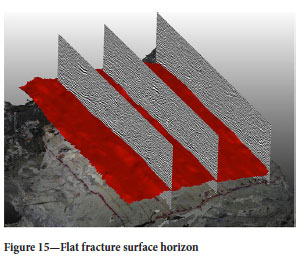
Figure 15 highlights the importance of acquiring and integrating 3-D datasets. By interpreting surface horizons within the 3-D GPR data, it becomes possible to generate detailed visualisations that significantly enhance the ease of data interpretation.
Discussion of results
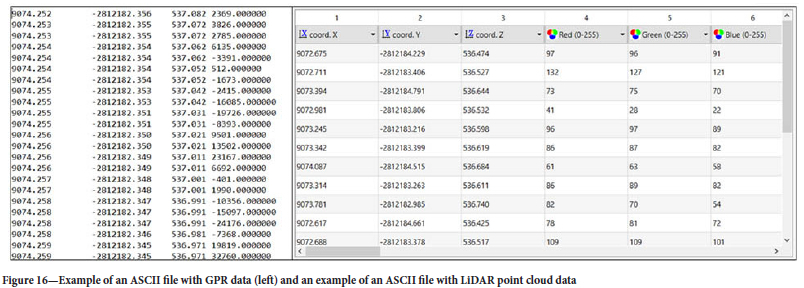
As illustrated previously, GPR data can offer insights into the stability of the rock mass, including details about jointing, fracturing, dome and pothole structures, as well as parting planes. For instance, through data interpretation, it becomes possible to detect fracture interactions that may lead to the potential development of key blocks within the hanging wall (such as in Figure 5). Identification of such structures can provide valuable information regarding hanging wall support requirements. The georeferencing process played a pivotal role in this study, bridging the gap between GPR data in the local coordinate system and the absolute mine coordinate system. The effort to integrate these datasets was met with challenges stemming from the different data acquisition systems, software packages, and the proprietary formats of the data. These complexities prompted an exploration into alternative data formats that would streamline the data integration process. The GPR data files are in a proprietary binary format, known as ".DT1," specific to Sensor & Software GPR systems, accompanied by an associated ".HD" file containing essential header details. These header details included critical information about the survey acquisition settings, such as acquisition date, trace count, point count per trace, survey start and end positions, nominal frequency, and more. Meanwhile, the LiDAR data files were provided in the ".e57" format, a recognised point cloud data format. To ensure seamless import into various software platforms and ease of data handling, the study opted for the using of American Standard Code for Information Interchange (ASCII) text files for the models. This choice not only enhanced user-friendliness but also improved data file manageability in terms of size. Figure 15 showcases an example of a GPR data file exported in ASCII text format, comprising columns for X, Y, and Z coordinates, alongside a scalar field representing signal strength amplitude. Figure 16 also illustrates a LiDAR data file in ASCII text format, with columns for X, Y, and Z coordinates, as well as additional scalar fields indicating properties like RGB values. These format choices were instrumental in overcoming data integration challenges and ultimately contributed to a more accessible and unified dataset for visualisation.
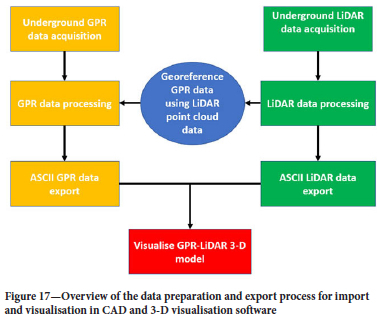
Figure 17 gives a summary of the process followed for the preparation, exporting, and importing of the different datasets in order to visualise the GPR-LiDAR 3-D model.
These results demonstrate the integration of LiDAR and GPR datasets for creating an enhanced model of the underground excavation for a better understanding of the rock mass. As demonstrated by Figure 15, interpreting surface horizons within the 3-D GPR data, it becomes possible to generate detailed visualisations that significantly enhance the ease and accuracy of data interpretation. Integration of GPR with other types of datasets has the potential to enhance the accuracy, completeness, and usefulness of underground information. GPR data, when combined with other datasets like LiDAR, geological surveys, or geophysical data, provides a more comprehensive view of underground structures and conditions. This comprehensive understanding, in turn, supports better decision-making, improved safety, and more efficient and cost-effective mining.
The primary motivation for transitioning from a local coordinate system to an absolute coordinate framework is to address limitations inherent in traditional geophysical data processing. While local coordinates can be effective for immediate data interpretation, the mining industry has identified a critical need to convert geophysical outputs to absolute mine coordinates to enhance data reliability and facilitate site revisitation over extended periods. Absolute coordinates provide a consistent spatial reference, mitigating the risk of losing or displacing local reference markers such as physical objects or spray paint, which are prone to degradation or removal over time.
Furthermore, integrating 3-D GPR data with georeferenced LiDAR point cloud datasets significantly improves spatial understanding of excavation geometries. This approach enables comprehensive visualisation of excavation such as the geometry, support element locations, variations in hanging wall and footwall topography, and the complex three-dimensional characteristics of features within the immediate hanging wall.
It is also important to note that structural features, such as parting planes or fractures, may exhibit orientations that are not parallel to the hanging wall surface, and a 3-D methodology is more effective in delineating the dip and extent of such features compared to isolated 2-D survey lines.
Conclusions and recommendations
The use of LiDAR data proved to be instrumental in the successful georeferencing of GPR data, facilitating its transformation from local survey coordinates to the absolute mine coordinates. The study provided a comprehensive georeferencing methodology, outlining a systematic step-by-step process, starting with the initial georeferencing of GPR data to the integration of GPR and LiDAR data to form a GPR-LiDAR 3-D model. This approach not only streamlined the visualisation of the integrated datasets but also promoted compatibility by using non-proprietary ASCII text files. Through this study, the research showcased the immense potential of integrating diverse datasets, thereby paving the way for the creation of more insightful and comprehensive models of the underground mining environment to enhance decision-making and contribute to the industry's zero-harm objective.
Further enhancements to the underground georeferencing methodology and integration of LiDAR and geophysical data sets such as GPR should be pursued through ongoing research. Specific areas of potential improvement include the logistics relating to the acquisition of LiDAR and GPR data and also possible further streamlining of the georeferencing and data integration steps.
Acknowledgements
The research team thanks the Mandela Mining Precinct through the Advanced Orebody Knowledge programme for funding of the research and Royal Bafokeng Maseve mine for providing the underground site.
References
Bubeck, A.A., Vsemirnova, E.A., Jones, R.R., Wilkinson, M.W. 2011. Combining GPR and terrestrial LiDAR to produce 3D virtual outcrop models. Leicester, UK, European Association of Geoscientists & Engineers. [ Links ]
CloudCompare. 2023. CloudCompare. [Online] Available at: https://www.cloudcompare.org/main.html [Accessed 14 June 2023]. [ Links ]
Grodner, M. 2001. Delineation of rockburst fractures with ground penetrating radar in the Witwatersrand Basin, South Africa. International Journal of Rock Mechanics & Mining Sciences, vol. 38, pp. 885-891. [ Links ]
Kgarume, T., Van Schoor, M., Nontso, N. 2019. The use of 3D ground penetrating radar to mitigate the risk associated with falls of ground in the Bushveld Complex platinum mines. The Journal of the Southern African Institute of Mining and Metallurgy, vol. 119, pp. 973-982. [ Links ]
Mandela Mining Precinct. 2023. Mandela Mining Precinct. [Online]+Available at: https://mandelaminingprecinct.org.za/advanced-orebody-knowledge-aok/ [Accessed 15 August 2023]. [ Links ]
Sensors & Software. 2023. Sensors & Software. [Online] Available at: https://www.sensoft.ca/products/noggin/systems/#Noggin500 [Accessed 14 August 2023]. [ Links ]
Singh, N. 2017. Weathering the 'perfect storm'. The Journal of the Southern African Institute of Mining and Metallurgy, vol. 117, pp. 223-229. [ Links ]
Van Schoor, M., Du Pisani, P., Vogt, D. 2006. High-resolution, short-range, in-mine geophysical techniques for the delineation of South African orebodies. South African Journal of Science, vol. 102, pp. 357-360. [ Links ]
Vogt, D., Van Schoor, M., Du Pisani, P. 2005. The application of radar techniques for in-mine feature mapping in the Bushveld Complex of South Africa. Journal of the South African Institute of Mining and Metallurgy, vol. 105, pp. 391-399. [ Links ]
White, H., Du Plessis, A., Noble, K., Treloar, M. 1999. Routine application of radar in underground mining applications. Oakland, 12th EEGS Symposium on the Application of Geophysics to Engineering and Environmental Problems. European Association of Geoscientists & Engineers. [ Links ]
 Correspondence:
T. Kgarume
Email: tkgarume@csir.co.za
Received: 17 Oct. 2023
Revised: 21 Apr. 2025
Accepted: 10 June 2025
Published: July 2025
