


Services on Demand
Journal

Article
 English (pdf)
 Article in xml format
 Article references
 Send this article by e-mail
Indicators
Related links
-
 Cited by Google
 -
 Similars in Google
Share

 Permalink
Journal of the Southern African Institute of Mining and Metallurgy
On-line version ISSN 2411-9717Print version ISSN 2225-6253
J. S. Afr. Inst. Min. Metall. vol.126 n.1 Johannesburg Feb./Jan. 2026
https://doi.org/10.17159/2411-9717/3805/2026
PROFESSIONAL TECHNICAL AND SCIENTIFIC PAPERS
Determining the impact of haulage optimisation on addressing open pit mining economic and environmental challenges: A case study
P. Malepfane; B. Genc
School of Mining Engineering, University of the Witwatersrand, South Africa. ORCiD: B. Genc http://orcid.org/0000-0002-3943-5103
ABSTRACT
This study proposes a new approach to reduce the environmental impact during surface mining by improving environmental factors through the incorporation of carbon footprint into strategic mine planning. Two key variables were analysed by contrasting and comparing the baseline and optimised models generated. These variables include net present value, which helps determine the financial feasibility of the mining models and their carbon emissions. The variables were analysed by using linear regression, Spearman's correlation, a P-value hypothesis, and an exponential decay test.
Results show that at Mine A the projected net present value was 62% higher than when running a baseline model. Furthermore, the net present value from the baseline model portrayed a high rate of decay at 0.667 versus 0.118 from the optimised model. This indicates the baseline model's sensitivity to long-term project timelines and fluctuating markets. The optimised method presents an opportunity to manage emissions during the high operational costs phases. It is represented by a 31% improvement in carbon emissions during the periods of high operational costs, whilst maintaining a positive net present value when compared with the baseline model. It was shown that the optimised model presents a better chance of achieving financial feasibility and balancing environmental impact, thereby ensuring that Mine A can align with the environmental aspect of economic, social, and governance principles through lowering the carbon footprint resulting from its hauling operations.
Keywords: haulage optimisation, environment, open pit mining, carbon footprint, mine planning, net present value
Introduction
Gold mining activities in the Asufiti North district of Ghana are known to cause environmental degradation. Such activities significantly impact farming within the region, and companies operating in this region have become increasingly susceptible to public scrutiny (Amankwa, 2023).
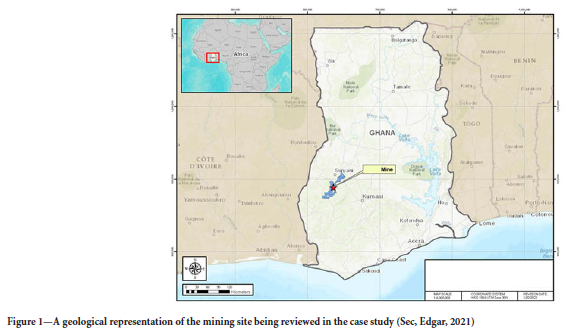
Mine A is one such mine, located in the gold mining region of Ghana, 300 km northwest of Accra (Sec, Edgar, 2021). The mine operates using both underground and open pit mining methods, with most of the gold being extracted through conventional open pit mining techniques, that is, truck and shovel. There are more than three active open-pit areas of varying size, but they can reach depths of 300 m (Sec, Edgar, 2021). These pits can be extensive, with robust infrastructure to support the mining and processing operations. Figure 1 shows the location of mine A within the Sunyani region of Ghana.
Mine A is characterised by rolling terrain, including valleys and ridges typical of the West African savannah. Forest reserves, farmlands, and rural communities define the region's landscape. Access to the mine is facilitated by major roads connecting it to the regional capital, Sunyani, and to the capital city of Accra (Sec, Edgar, 2021). The proximity to key infrastructure such as highways, electricity, and water resources ensures that mining activities are well-supported logistically (Sec, Edgar, 2021). However, managing the mine's geographic impacts-particularly land use and the socio-economic effects on nearby communities-remains a critical concern for the operators and the government (Ghana Chamber of Mines, 2022). These concerns arise because Mine A uses surface mining methods, such as truck and shovel operations, to extract the ore. Accessing these ores for economic benefit involves the clearance of vast hectares of land, leading to environmental degradation and excavation, which causes landscape deterioration and a negative impact on air quality (Sasmito et al., 2016). Despite surface mining operations contributing greatly to the global economy, they are not immune to the challenges faced by the mining industry today.
Surface mining impact on environment
Surface mining impact on the environment is well documented. A surface mining operation is more susceptible to the following factors (Phillips, 2016):
> Public scrutiny - ease of accessibility, operating close to local communities.
> Environmental conditions - wind can exacerbate dust conditions and an overall shift in climatic conditions.
> Operational costs - fuel increases, labour costs, maintenance costs.
All the above-listed challenges are related to the frameworks of economic, social, and governance (ESG), which have become a major role player in the investment sector. The South African Code for Reporting of Exploration Results, Mineral Resources and Mineral Reserves (SAMREC) has further highlighted the impact of global ESG shift by incorporating it into its reporting guidelines (SAMCODES, 2017). First released in 2016, the South African guideline for reporting of environmental, social, and governance parameters (SAMESG) provides guidance on, but is not limited to (SAMCODES, 2025):
> Key environmental parameters
> Risk analysis and materiality
> Audits on conformance and compliance.
Furthermore, a study conducted by Evans et al. (2023) suggests that the ESG-related challenges will continue to threaten the viability of companies, especially those that are resource intensive, such as mining in South Africa. Statistically, it is nearly impossible to achieve a high score on all three pillars of ESG and maintain profitability due to the complexity of the frameworks (Evans et al., 2023). Therefore, it is ideal to target each individual pillar. For this study, the pillar of relevance is the environment.
Amoako et al. (2018) studied the carbon footprint of Ghana's gold mining industry. Their research discovered that 12 gold mines in the Birimian complex contributed significantly to the carbon emissions directly from the mining activities and indirectly from processing and other third-party activities. Mine A, though fairly new, operates within this region, where there are growing concerns about the effects of mining on the environment and mounting pressure for mining operators to show accountability.
Greenhouse gases (GHG) are often categorised into primary and secondary, where primary emissions are necessary for maintaining atmospheric balance, and secondary emissions are a result of the gradual increase in industrialisation (Tuckett, 2019). These secondary GHGs include carbon dioxide (CO2), methane (CH4), chlorofluorocarbons (CFCs), tropospheric ozone (O3), and nitrous oxide (N2O) (Watson et al., 2018).
GHG emissions are classified into three categories (UNFCCC, 2020):
• Scope 1 emissions: Direct emissions resulting from an organisation's activities that the organisation can control, such as burning fuels by mobile or stationary vehicles.
• Scope 2 emissions: Indirect emissions resulting from activities that directly benefit an organisation, such as emissions from generating electricity used in the processing plant.
• Scope 3 emissions: Indirect emissions not included by Scope 1 or Scope 2, such as emissions due to employee travel or goods purchased by the organisation.
The Paris Agreement aims to reduce global GHG emissions to cap global warming to 1.5 degrees Celsius, influencing ESG frameworks to manage varying factors such as climate change and environmental degradation (UNFCCC, 2020). Sustainable mining has become a necessity, with multiple operations adopting ESG strategies to report on energy consumption, GHG emissions, air quality, water management, and land use (European Banking Authority, 2025). Energy production remains the primary source of GHG emissions in South Africa, contributing around 80% of the country's total emissions (DEA, 2016). This is not unique to South Africa; a similar trend was observed in Ghana's gold mining industry, where fuel and electricity use contributed significantly to GHG emissions (Amoako et al., 2018). This indicates that the trend between GHG emissions and the mining industry is prominent in South Africa and globally, necessitating an effective resolution through technology adoption and adaptation. Plenty of work has been done on ESG and its effects on profitability and its role in the future of mining; however, not much has been done on the practical application of the principle in everyday mining activities (Nehring, Knights, 2024). That is the research gap that this research aims to fill.
Studies have shown that optimised haulage operations can reduce CO2 emissions by up to 20%, contributing to more sustainable mining practices (Feng et al., 2020). Surface mining truck fleets constitute the highest amount of operational costs owing to their quantity and ratio to loaders, but they also consume the highest amount of fuel (Dindarloo, Siami-Irdemoosa, 2016). Several studies have proven that haulage optimisation software can substantially improve fuel efficiency by optimising truck routes and reducing idle times (Barnewold, Lottermoser, 2020).
The implications of ESG on mining are over-extensive, with mounting pressure from stakeholders to reduce environmental impact, improve social responsibility, and ensure transparent governance. However, reaching these goals without increasing costs poses a significant challenge. Hence, this study seeks to answer if mine planning software aids the industry in improving its current operations without increasing costs and maintaining alignment with the ESG frameworks by reducing the environmental impact and achieving sustainable mining.
Methodology
This study integrated qualitative and quantitative research methods to determine the effectiveness of mine planning software in optimising the haulage plan of a gold mining company in West Africa. The qualitative research method entailed collecting and analysing information to help understand the status of optimiser applications in the mining industry. This was achieved through reviewing documentation in the form of reports, journal articles, book sections, and websites, as follow:
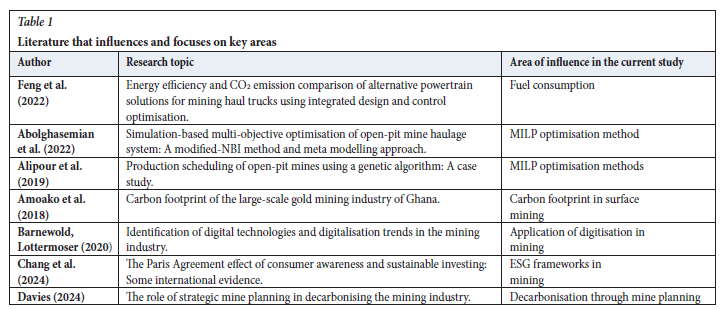
> Thematic literature review: This review involved reviewing reports (extending over a decade) with common themes such as the application of technology in mining, the adoption of technology in mining, the ideal solvers for effective optimisation of mining software NPV models, and insights into the environment vs technology, refer to Table 1.
> It aided in the identification of common issues faced in the industry concerning technology as well as a constraint-based analysis: Integrating the knowledge from the literature review with the constraints identified on-site to draw context to the conditions on-site, further aiding in developing a scope of work and research limits.
For the quantitative component, operational data was collected from Mine A. This included planned daily production volumes, ore grades, operational costs, maintenance schedules, and revenue projections. The data were collected and stored in the mine's database over six months.
Secondary data, including market forecasts and commodity price predictions, were also integrated from publicly available reports by industry analysts (PWC, 2024). Other data, such as the equipment specifications, operating costs, mine layout, and ore reserves were shared via a .CSV file and other MS Excel file sheets. Furthermore, the data were verified against historical records and confirmed by mine engineers for accuracy. The data were cleaned to eliminate outliers, gaps, and errors. Spot checks ensured data consistency and removed any anomalies.
The quantitative process focused on two main areas, which are the NPV and the fuel consumption. To determine these key focus areas, the validated operational data from the mine was input into a financial optimisation solver in Hexagon's MinePlan Schedule Optimiser, which was available for this study. The model was built using multiple simulations to test different operational scenarios. The model's primary objective was to maximise the NPV and generate the equivalent fuel consumption by adjusting key variables such as mining rate, operational cost, and production schedules and observing constraints such as equipment fleet and dump capacity.
A scenario analysis was derived using the information obtained from the engineers, such as the loading area, dump capacity, material type, the desired output NPV, and fuel burned to achieve the desired NPV. The second aspect of the quantitative method involved obtaining data on the fuel consumed by the baseline and optimised mining models. The carbon footprint was calculated under the same ideal conditions to assess its consistency with the optimised NPV.
Calculating carbon footprint
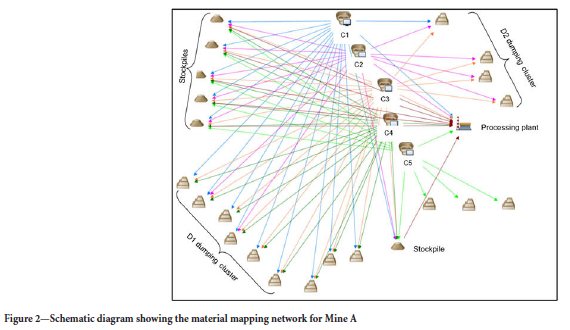
Scenario analysis uses engineer-provided data-loading area, dump capacity, material type, desired NPV, and fuel consumption-to assess outcomes. Figure 2 illustrates how material is mapped from each loading to dumping area using the shortest or optimal route. Mining cut C2 has material eligible for both D1 and D2 dumps, but to meet constraints and maximise NPV, no material goes to D1 due to longer travel times and higher cycles. Total travel distance (empty and full) is multiplied by each truck's fuel burn rate over a set period to determine total fuel consumption, which is essential for carbon footprint calculations.
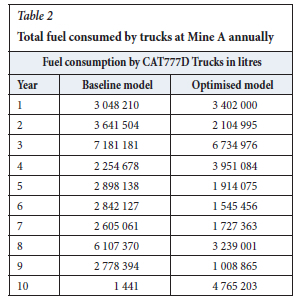
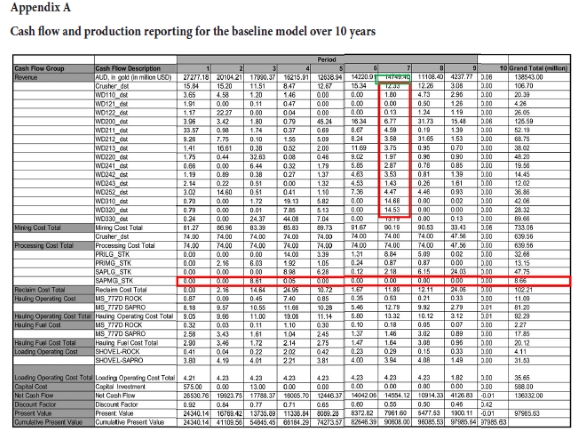
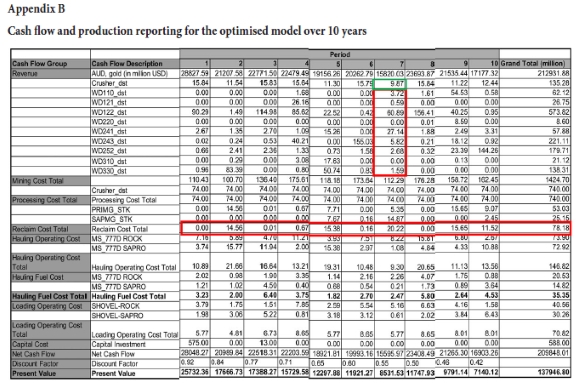
The software repeats this methodology multiple times to produce the results in Appendix A and Appendix B. The fuel consumed by the baseline and optimised mining models, with loading and dumping per Appendices A and B, was computed as shown by the report in Table 2, which provides the amount of fuel consumed annually by the truck fleet in alignment with the financial performance in the tables in Appendix A and B. Furthermore, under the same ideal conditions, the calculation for carbon footprint was conducted to determine coherence between the optimised NPV and the resulting carbon footprint. The final output of the model was a set of recommendations for operational adjustments that would optimise the NPV (sustainably) of the mining site within the set constraints.
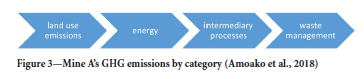
Carbon footprint estimation calculations can be complex and may differ from operation to operation; to simplify the approach, it is best to start by identifying the key sources of GHG emissions (IPCC, 2019). Mining operations necessitate extensive land use, followed by the implementation of processes to reduce extracted rock into smaller, mineable fragments. Substantial energy is required for both breaking the rock and transporting it from its original location to designated processing sites. Processing at the plant must be employed to obtain the mineral of interest. These are all categories of GHG emissions at Mine A elaborated in Figure 3.
This research only focused on Scope 1 emissions, that is, emissions resulting from Mine A's direct activities. Based on the literature reviewed by Amoako et al. (2018) and the DEA (2016), energy-related activities account for the highest GHG emissions globally. Therefore, the category of interest for this research was Scope 1 emissions within the energy category. The energy category is divided into two subcategories: mobile combustion and electricity. The key focus of this research is on mobile combustion, which contains activities such as the transportation of personnel and the hauling of materials and goods (IPCC, 2019).
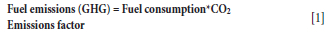
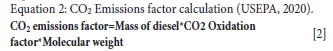
Tier 1 methods were applied for this calculation and used two key equations to estimate the carbon emissions, as indicated in the following Equations 1 and 2. It is important to note that, though the emitted gases do not only comprise CO2, they are also reported in CO2 equivalents for ease of comparison (IPCC, 2006). For example, a single kilogramme (kg) of CH4 equals 28 kg of CO2 (IPCC, 2019). Furthermore, under the guidelines of the United States Environmental Protection Agency (USEPA, 2020) and Amoako et al. (2018), the following assumptions are necessary for more accurate estimations:
> Regarding CO2 equivalents, CH4 and N2O account for 5% of diesel engine combustion emissions. All CO2 estimates will be multiplied by 1.05 to account for this.
> Any emission of CO is rendered negligible compared to CO2.
> Fuel is converted to CO2 during combustion.
where:
Fuel consumption is the total fuel burned over a particular period by a source.
CO2 emissions factor is a given GHG's default emission factor by fuel type.
where:
Mass of diesel, in this instance, equates to 1 gallon of diesel, convert litres to gallons.
Oxidation factor for CO2 is usually 1; however, for this research, it was assumed to be 0.99 to account for residual fuel that may be left not combusted. Molecular weight is the ratio of the molecular weight of CO2 to carbon.
Taking fuel consumption generated from Mine Plan's software, applying the assumptions and Equations 1 and 2, the carbon footprint is derived, as indicated in Table 3.
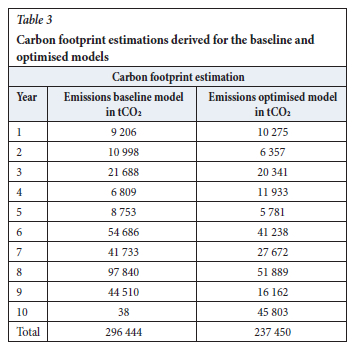
It must be noted that the total carbon footprint of the baseline model is 58 994 tCO2 higher than the optimised model. This difference is greater than the 10-year average of the baseline model.
Results and discussion
To analyse the relationship between the datasets generated from the software and calculations, four methods are applied:
i Simple linear regression. This method of analysis was chosen because it allows for the investigation of the relationship between two variables: time in years and NPV (Sykes, 1993).
ii Spearman's correlation. The Spearman rank test uses data ranks to aid in deriving a linear relationship from data that would have been considered non-linear and not fit for parametric analysis (Al-Hameed, 2022).
iii P-value hypothesis test to test the validity of the results against a set hypothesis.
iv Exponential decay test for the sensitivity of the NPV from the derived models over a particular period because it is well known that discounted cash flows exhibit an exponential relationship with time (Campos et al., 2015).
Analysis of the NPV and carbon emissions at Mine A
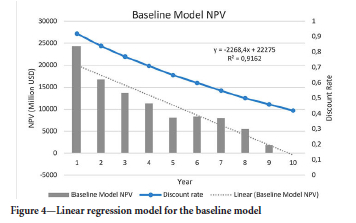
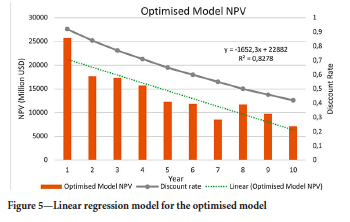
The linear regression analysis revealed that the baseline model's NPV trend line produces a much sharper decline than the optimised model's NPV between year 1 and year 10, as indicated in Figures 4 and 5. The regression model for the baseline model gives y = 7530.4 when x = 6.5, while the regression model for the optimised model gives y = 12142.1. This indicates that the optimised model yields an NPV approximately 62% higher than the baseline model. The accuracy of this prediction is further substantiated by strong R2 values: R2 = 0.9162 for the baseline model and R2 = 0.8278 for the optimised model. The residual plots analysis further tested the accuracy of the linear models, confirming that there is neither an identifiable pattern in the data nor correlation with the predicted models.
Analysis of the relationship between NPV and carbon emissions
By observation of the analysis on NPV and emissions in the aforementioned, it could be assumed that in both the baseline and optimised models, there is an inverse relationship between the NPV and the carbon emissions resulting from hauling material from one design point to another at Mine A. However, to test this assumption, a non-parametric test can be employed since the relationship between NPV vs carbon emissions results in a distribution that is not normal and cannot be explained directly by linear regression. To run this test, the following holds:
> Each numerical variable is assigned a representative number by rank from smallest to largest.
> The ranks represent the data from which a relationship or correlation between the original data can be derived.
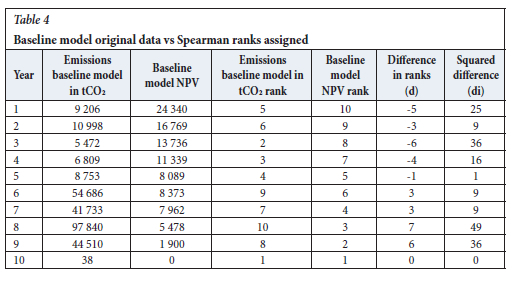
Table 4 indicates the original data and the assigned ranks per value for the baseline model, which is employed in performing the Spearman rank test. Equation 3 can be used together with Table 4 to determine Spearman's correlation coefficient (rs). The sum of the squared differences is 190 and the number of years is 10. This gives an rs of -0.2, meaning that there is a negative relationship between the NPV and carbon emissions of the baseline model at Mine A.
Equation 3: Spearman's correlation equation (Al-Hameeda, 2022).

where:
Spearman's correlation (rs ) is between -1 and 1.
 is the sum of the squared difference in ranks between the NPV and the carbon emissions.
n is the number of years.
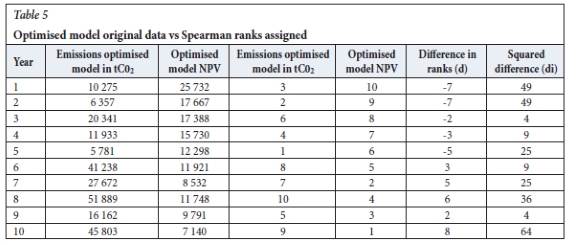
A similar analysis is then applied to the optimised model using Table 5 and Equation 3. For the optimised model, the sum of squared differences is 274, and the number of years is 10. This yields an rs of -0.7, implying that the relationship between the NPV and the carbon emissions of the optimised model at Mine A is also negative.
The Spearman's rank test has determined that from the data presented for both models, the relationship between the NPV and the carbon emissions is negative, meaning that an increase in one variable results in a decrease in the other. However, the true benefit of this analysis is in determining whether this finding holds true at any given point in time. In order to determine that, another test can be performed, the probability test, to determine the probability that the hypothesis above is true at any given time. The following assumptions hold:
> Null hypothesis (H0): There is no inverse relationship between NPV and carbon emissions at Mine A for both the baseline and optimised models.
> Alternative hypothesis: There is an inverse relationship between NPV and carbon emissions at Mine A for both the baseline and optimised models.
> The null hypothesis is rejected when the probability value is lower than the significance level; and accepted when the probability value is equal to or greater than the significance level.
The level of statistical significance is assumed to be 0.05 or 5%. This is an ideal assumption for statistical analysis, where the intention is to measure probability against a null hypothesis for time series data sets (Vaidyanathan, 2023). For this study, probability value (p-value) refers to the strength of evidence against the null hypothesis, which states that there is no difference in the relationship identified between one or more variables in a sample and a population (Thiese et al., 2016). Table 6 indicates the output regression statistics generated from the carbon emissions and the NPV. It can be noted that for the baseline model, the NPV indicates a p-value of 0.68, which is greater than the threshold, thereby suggesting that the null hypothesis is true. This means that the inverse relationship between NPV and carbon emissions is always true for any given period in the baseline model.
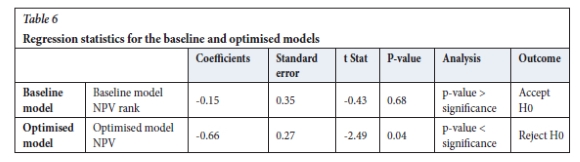
In the optimised model, the NPV generated a p-value of 0.04, which is slightly lower than the threshold, implying a strong rejection of the null hypothesis regarding an inverse relationship between the NPV and carbon emissions. There is, therefore, not enough statistical evidence in the data collected at Mine A to conclusively state that the relationship between NPV is inversely proportional to carbon emissions at any given time. Though it may appear to be the case by visual inspection, it is not statistically significant. This means that attempting to generate a predictive model from this data set based on the assumption of inverse proportionality may significantly yield incorrect results in the optimised model.
The Spearman rank test determined that there is a negative relationship between NPV and carbon emissions for both the baseline and optimised models. The correlation coefficient for the baseline model is -0.2, and for the optimised model, it is -0.7. This means that an increase in one variable results in a decrease in the other. The p-value hypothesis test showed that the inverse relationship between NPV and carbon emissions is always true for any given period in the baseline model. However, for the optimised model, the relationship is not statistically significant. This means that attempting to generate a predictive model based on the assumption of inverse proportionality may yield incorrect results for the optimised model. Furthermore, this means that there is room for change or improvement with the optimised model, which is not possible with the baseline model during the periods of high operational costs.
Analysis of the relationship between discount rate and NPV at Mine A
The discount rate is a major factor in discounted cash flows as it provides a more realistic value of money over time. In this study's data, the discount period is set to end of period, starting at 9% in year 1 and decreasing gradually. This makes it important to identify how it relates to the NPV over the specified period to understand the financial viability of the mine plan. Table 7 shows the regression statistics of the baseline model and the optimised model NPVs against the discount rate over 10 years. A multi-linear regression methodology is applied to explain this relationship because a simple linear regression method does not give a clear indication of the impact of discount rate on NPV. For the NPV vs discount rate, the H0 states that, at any given time at Mine A, the discount rate has little to no effect on the NPV
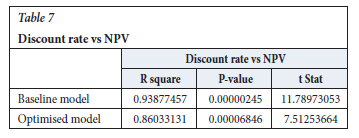
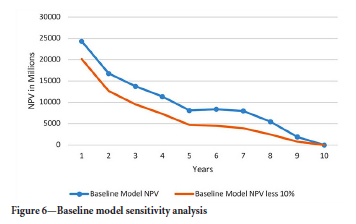
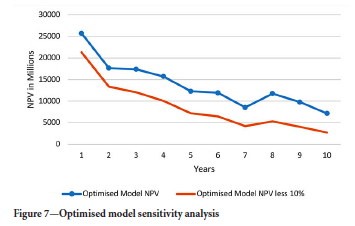
This data indicates a trend similar to NPV vs time. There is a strong correlation (93% for baseline and 86% for optimised model) of the NPV and the discount rate with the baseline model, indicating a stronger relationship at 93% due to a better dispersion of data about the mean. For both models, the p-value is well below the 5% level of significance, meaning that the H0 hypothesis is rejected. Though there is a high correlation in the data, it is clear that the discount rate does affect the NPV. This may imply that the NPV is sensitive to the discount rate. To substantiate this, a sensitivity analysis is performed on the NPV by assuming a constant 10% decrease in discount rates from 1 to 10. The results, indicated by Figures 6 and 7, show an overall decrease in total NPV by 33% in the baseline model and 30% for the optimised models.
It must be noted that though both models relate similarly to the discount rate, the optimised model outperforms (3% more) the baseline in its ability to cushion the NPV from fluctuating markets and volatile environments.
The discount rate is a crucial factor in discounted cash flows as it provides a more realistic value of money over time. The study sets the discount period to end of period, starting at 9% year 1 and decreasing gradually. A multi-linear regression methodology was applied to explain the relationship between the discount rate and NPV, showing a strong correlation between the discount rate and NPV, with R2 values of 93% for the baseline model and 86% for the optimised model indicated in Appendix B. The p-value was well below the 5% level of significance for both models, indicating that the NPV is sensitive to changes in the discount rate.
Analysis of the relationship between NPV and time at Mine A
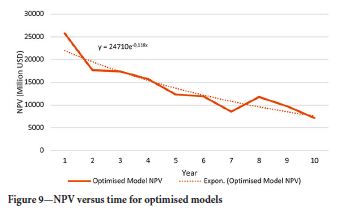
It is well known that discounted cash flows exhibit an exponential relationship with time (Campos et al., 2015). Generally, in the NPV calculation, time is defined as the independent variable and is plotted on the x-axis, while NPV is the dependent variable plotted on the y-axis. These trends indicate exponential decay or negative growth, meaning that the present value contribution of each year's cash flow decreases exponentially over time. To test the validity of this, an exponential analysis was applied.
An exponential line of best fit was derived from the NPV datasets of both models. This equation implies that a higher rate of decay (high discount rate) results in a faster exponential decay, impacting long-term investments negatively, and the converse is also true. Applying this to the case study models, the baseline model portrays a steeper decay (Figure 8 versus Figure 9) as opposed to the optimised model, though the same discount rates were applied for both models. In the baseline model, the rate of decay is equal to 0.667, whilst in the optimised model, it is only 0.118. It therefore means that the baseline model is susceptible to longer project periods, making it least ideal for a long-term 10-year project.
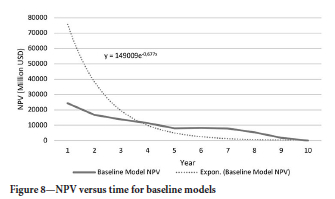
Increasing the discount rate can impact the models negatively, however, the most affected model is the baseline, indicated by the high rate of decay. Mining operations rely on long-term NPV to cushion against capital-intensive projects such as a processing plant enhancement. High rates of decay, such as that of the baseline model, provide an idea of the level of risk associated with a particular investment or, in this case, a particular model. Also, if Mine A continues to mine per the baseline model (to combat the effects of a lower NPV), they may need to opt for more intensive resource depletion in the earlier years of mining. This can result in high fuel consumption and, inadvertently, high carbon emissions.
Key observations
A study by Amoako et al. (2018) on the carbon footprint of Ghana's large-scale gold mining industry aligns well with the scope of research for Mine A. This study provides a detailed approach to understanding the baseline carbon footprint for gold mines in the West African region, which is the location of Mine A. A similar approach was employed to determine the carbon footprint of haulage trucks at Mine A.
The NPV analysis indicates that the NPV has an exponential relationship with time. Over time, the baseline models' NPV decays faster than the optimised, making the optimised model least ideal for a mining operation intending to operate profitably over the long term.
Based on the analysis, the optimised model proves to be a better schedule in comparison to the baseline model, which was one of the objectives of the study. It is indicated by the NPV analysis resulting in a linear predictive model that shows that the baseline model will always yield an NPV that is 62% lower than the optimised model at Mine A. A residual plot analysis was further employed to substantiate this statement. From these residual plots, the predictive linear model is true and presents an accurate representation of the data analysed. Furthermore, an outlier was identified in the baseline and optimised models' residual plots. This outlier is a result of the first year of mining, where operations are slowly ramping up and operational costs are lower. It is a common phenomenon and is to be expected for new projects such as Mine A. Therefore, based on the NPV analysis, the Mine Plan software has been able to optimise the baseline to yield a better and positive projected NPV throughout the planned 10 years.
However, the objective of this study was not only to optimise NPV, but to determine if the optimised NPV would yield a sustainable mining plan. This was also tested by reviewing the carbon footprint resulting from these mining models. The total fuel consumption associated with each model's NPV was collected and analysed. This fuel data was then converted to carbon emissions to improve comparability. By analysing the carbon emissions, the carbon footprint of each model was derived. At a glance, the carbon footprint of the baseline model and the optimised model may exude a similar trend. However, further analysis indicates that between year 1 to 5, the carbon emissions of the baseline model are 25% lower than that of the optimised model. This is because the baseline model operates on the shortest and easiest access routes during this period, whereas the optimised model seeks to ensure that it mines in sequence. Between year 6 to 10, the baseline and optimised models both show an increase in carbon footprint owing to an increase in fuel consumption due to an increase in travelling distances, that is, pit expansion farther from the main surface infrastructure and stockpiles. During this period, the baseline model's carbon footprint exceeds that of the optimised model by 31% owing to the fact that the model has exhausted the shorter hauls and often hauls from C5 to the stockpiles. This finding indicates that when operational costs increase, the optimised model is the ideal model in that it produces the highest NPV and lowest carbon footprint for the 10-year period at Mine A.
It would not do the research justice to only analyse NPV and carbon footprint independently, as it is not clear how the two variables relate. Therefore, another analysis was performed to determine if a relationship exists between the NPV and carbon footprint. By observation of the graphical representation of the data, one can assume that NPV is inversely proportional to carbon footprint for both the baseline and optimised models. Hence, the Spearman's correlation test was conducted. The purpose of the test was to determine if a correlation (relationship) exists between the two variables. By applying Spearman's equation to the baseline and optimised models' data sets, a correlation coefficient of -0.2 and -0.7 were calculated for the baseline and optimised models, respectively. The negative sign indicates a negative relationship, meaning that it can be conclusively stated that for both the baseline and the optimised models, the NPV is inversely proportional to the carbon emissions. This means that an increase in one variable will result in a decrease in the other at Mine A. Do note that this remains true for the baseline model, especially when operational costs are high. However, the optimised model offers a chance to mitigate this by reviewing multiple scenarios and maintaining the sequence to achieve all set objectives.
The hypothesis test was conducted employing the p-value test to determine if this conclusion is true at any point in time at Mine A. Results show that the conclusion holds for the baseline model only. It appears that the optimised model's inverse proportionality is only representative of this particular data set. This means that using a predictive model to determine carbon emissions outside this data range could provide incorrect data. Furthermore, this elaborates the need for concurrent incorporation of the carbon footprint calculations simultaneously with the cash flow projections during the planning phase to ensure that the correct values are obtained and the informed assumptions are made.
The final hypothesis test was employed to determine the relationship between NPV and discount rate. It can be said that NPV is indeed dependent on the discount rate. This can be observed by analysing the sensitivity of the NPV against a changing discount rate, showing direct proportionality to the discount rate for both models. However, the optimised model is less sensitive to the discount rate when compared with the baseline model.
Conclusions
This study has confirmed that primarily focusing on NPV as a success criterion can be short-sighted. This is because the mine planning optimisation engines do not have a carbon emissions estimator built into the mine planning software. Therefore, by default, the system always optimises for productivity and profitability instead of striking a balance.
To achieve sustainable mining, the relationship between NPV and carbon footprint should be investigated simultaneously and concurrently with long-term planning. This way, a more proactive approach is adopted towards reducing carbon emissions from the initial stages, rather than only proactively in mine rehabilitation and mine closure. Mine planning software developers need to incorporate carbon footprint calculations into the long- to short-term planning modules of the software. A proactive approach facilitates informed decision-making; for example, at Mine A, choosing the optimised model increases the probability by 62% and enables the strategy team to evaluate NPV relative to years associated with elevated carbon emissions. This short-term compromise, if efficiently reported in the now-mandatory annual ESG reports, could improve funding and investment opportunities by demonstrating proactive, sustainable mining practices. This also supports a more responsible mining industry.
It is recommended that the study is expanded to cover multiple commodities and industries. Mine A and other mining operations should consider incorporating carbon footprint estimations throughout the life of mine planning to improve environmental awareness and adopt a proactive approach to sustainable mining.
Acknowledgements
The work reported in this paper is part of an MSc research report in the School of Mining Engineering at the University of the Witwatersrand, Johannesburg, South Africa.
References
Abolghasemian, M., Kanafi, A.G., Daneshmand-Mehr, M. 2022. Simulation-Based Multiobjective Optimization of Open-Pit Mine Haulage System: A Modified-NBI Method and Meta Modeling Approach. Complexity, 3540736, doi: https://doi.org/10.1155/2022/3540736 [ Links ]
Al-Hameeda, K. 2022. Spearman's correlation coefficient in statistical. International Journal for Nonlinear Analytical Application, vol. 22, pp. 3249-3255. doi: https://doi.org/10.22075/ijnaa.2022.6079 [ Links ]
Alipour, A., Khodaiari, A., Jafari, A., Tavakkoli-Moghaddam, R. 2019. Production scheduling of open-pit mines using genetic algorithm: a case study. International Journal of Management Science and Engineering Management, vol. 15, no. 3. doi: https://doi.org/10.1080/17509653.2019.1683090 [ Links ]
Amankwa, E. 2023. Assessing The Impact of Gold Mining activities on the Land from 2010 to 2020, A case study od Asutifi North District of Ghana. Department of Geology and Resource Development. Accra: University of Ghana. Retrieved January 08, 2025. [ Links ]
Amoako, Y. K., Gordon, C., Sakyi, P. A., Gyimah, R. 2018. Carbon Footprint of the Large Scale Gold Mining Industry of Ghana. West African Journal of Applied Ecology, vol. 26, pp. 242-260. Retrieved from https://www.ajol.info/index.php/wajae/article/view/182523 [ Links ]
Barnewold, L., Lottermoser, B. 2020. Identification of digital technologies and digitalisation trends in the mining industry. Institute of Mineral Resources Engineering. Aachen: International Journal of Mining Science and Technology. Retrieved July 18, 2024. [ Links ]
Campos, J., Serebrisky, T., Suárez-Alemán, A. 2015. Time goes by: recent developments on the theory and practice of the discount rate. Inter-American Development Bank. Inter-American Development Bank. doi:IDB-TN-861 [ Links ]
Chang, Y., Cheung, W.M.Y., Chung, M, Tan, H. 2024. The Paris Agreement effect of consumer awareness and sustainable investing: Some international evidence, Pacific-Basin Finance Journal, vol. 85, p. 102394. [ Links ]
Davies, M. 2024. The Role of Strategic Mine Planning in Decarbonising the Mining Industry. Mining, Metallurgy & Exploration 41, pp. 2783-2785. [ Links ]
European Banking Authority. 2025. Guidelines on the management of environmental, social and governance (ESG) risks. European Banking Authority. Retrieved January 09, 2025, from https://www.eba.europa.eu/sites/default/files/2025-01/fb22982a-d69d-42cc-9d62-1023497ad58a/Final%20Guidelines%20on%20the%20management%20of%20ESG%20risks.pdf [ Links ]
Evans, D., Kramer, G.A., Lanfranchi, M., Brijlal, P. 2023. Environmental, social and corporate governance (ESG) on the financial performance of listed mining firms in South Africa. Cape Town: International Journal of Business and Economic Sciences Applied Research (IJBESAR). ISSN 2408-0101. Vol. 16. Issue 2. P42-52. doi:DOI: 10.25103/ijbesar.162.05 [ Links ]
Feng, Y., Liu, Q., Yang, J., Dong, Z. 2022. Energy efficiency and CO2 emission comparison of alternative powertrain solutions for mining haul truck using integrated design and control optimization. Journal of Cleaner Production, vol. 370, no. 133568. doi: https://doi.org/10.1016/j.jclepro.2022.133568 [ Links ]
Ghana Chamber of Mines. 2022. Our Publications. Retrieved October 18, 2024, from Ghana Chamber of Mines: https://ghanachamberofmines.org/media-centre/our-publications/ [ Links ]
IPCC. 2006. 2006IPCC Guidelines for National Greenhouse Gas Inventories: Stationary Combustion. Intergovernmental Panel on Climate Change. Retrieved from https://www.ipcc-nggip.iges.or.Jp/public/2006gl/pdf/2Volume2/V2_2_Ch2_Stationary_Combustion.pdf [ Links ]
IPCC. 2019. Revised 1996 IPCC Guidelines for National Greenhouse Gas Inventories: Workbook. Bangkok: Intergovenemntal Panel on Climate Change. Retrieved from https://www.ipcc.ch/report/2019-refinement-to-the-2006-ipcc-guidelines-for-national-greenhouse-gas-inventories/ [ Links ]
Minerals Council of South Africa. 2023a. How mining contributes to South Africa. Retrieved October 18, 2024, from Minerals Council of South Africa: https://www.mineralscouncil.org.za/reports/2023/downloads/mcsa-iar2023-our-context.pdf [ Links ]
Minerals Council South Africa. 2023b. Facts and Figures 2022. Retrieved from https://www.google.com/url?sa=t&rct=j&q=&esrc=s&source=web&cd=&ved=2ahUKEwiJ6ZnV0sGGAxXO8gIHHRzhANsQFnoECBUQAQ&url=https%3A%2F%2Fwww.mineralscouncil.org.za%2Findustry-news%2Fmedia-releases%2F2023%3Ftask%3Ddownload.send%26id%3D1997%26catid%3D89%26m%3D0&usg [ Links ]
Nehring, M., Knights, P. 2024. A Systems Engineering Approach to Incorporate ESG Risks and Opportunities in Early-Stage Mine Design and Planning. Queensland: The University of Queensland. Doi: https://doi.org/10.3390/mining4030031 [ Links ]
Phillips, J. 2016. Climate change and surface mining: A review of environment-human interactions & their spatial dynamics. Applied Geography, vol. 74, pp. 95-108. doi: https://doi.org/10.1016/j.apgeog.2016.07.001 [ Links ]
PWC. 2024. PWC. Retrieved September 25, 2024, from https://www.pwc.com/gx/en/industries/energy-utilities-resources/publications/mine.html [ Links ]
Sasmito, A., Kumral, M., Peralta, S. 2016. Reliability effect on energy consumption and greenhouse gas emissions of mining hauling fleet towards sustainable mining. Journal of Sustainable Mining, vol. 15, no. 3, pp. 85-94. doi: https://doi.org/10.1016/j.jsm.2016.08.002 [ Links ]
SAMCODES. 2017. SAMCODES. Retrieved December 2, 2025, from SAMCODES: https://www.samcode.co.za/samcode-ssc/samesg [ Links ]
SAMCODES. 2025. SAMCODES. Retrieved December 2, 2025, from SAMCODES: https://www.samcode.co.za/samcode-ssc/samesg [ Links ]
Sec, Edgar. 2021. United States Securities and Exchange Commission. Retrieved September 25, 2024, from https://www.sec.gov/Archives/edgar/data/1164727/000116472722000007/exhibit963-ahafooperations.htm [ Links ]
Siami-Irdemoosa, E., Dindarloo, S. 2016. Determinants of fuel consumption in mining trucks. Energy, vol. 112, pp. 232-240. doi: https://doi.org/10.1016/j.energy.2016.06.085 [ Links ]
Sykes, A. 1993. An Introduction to Regression Analysis. University of Chicago Law School, Institute for Law and Economics. Chicago: University of Chicago Law School. Retrieved February 18, 2025, from https://chicagounbound.uchicago.edu/cgi/viewcontent.cgi?article=1050&context=law_and_economics [ Links ]
Thiese, M., Ronna, B., Ott, U. 2016. P value interpretations and considerations. Journal of Thoracic Disease, pp. 928-931. doi: PMCID: PMC5059270 PMID: 27747028 [ Links ]
Tuckett, R. 2019. Greenhouse Gases. Encyclopedia of Analytical Science, pp. 362-372. Retrieved January 09, 2024, from https://research.birmingham.ac.uk/en/publications/greenhouse-gases [ Links ]
UNFCCC. 2020. United Nations Framework Convention on Climate Change. Retrieved January 09, 2025, from United Nations Framework Convention on Climate Change: https://unfccc.int/process-and-meetings/the-paris-agreement [ Links ]
USEPA. 2020. Fuel oil combustion. United States Environmental Protection Agency (pp. 3-30). United States Environmental Protection Agency. Retrieved 02 14, 2025, from https://www.epa.gov/sites/default/files/2020-09/documents/1.3fuel_oil_combustion.pdf [ Links ]
Vaidyanathan, K. 2023. Significance of Hypothesis and P value. Indian Prosthodontric Society, vol. 23, no.2, pp. 103-104. Doi:10.4103/jips_131_23 [ Links ]
Watson, R., Rhode, H., Oeschger, H., Siegenthaler, U. 2018. Greenhouse Gases and Aerosols. Intergovernmental Panel on Climate Change. Retrieved January 09, 2025, from https://www.ipcc.ch/site/assets/uploads/2018/03/ipcc_far_wg_I_chapter_01.pdf [ Links ]
 Correspondence:
B. Genc
Email: bekir.genc@wits.ac.za
Received: 9 Sept. 2025
Revised: 13 Oct. 2025
Accepted: 4 Dec. 2025
Published: January 2026
Appendix A
Appendix B
