


Services on Demand
Journal

Article
 English (pdf)
 Article in xml format
 Article references
 Send this article by e-mail
Indicators
Related links
-
 Cited by Google
 -
 Similars in Google
Share

 Permalink
R&D Journal
On-line version ISSN 2309-8988Print version ISSN 0257-9669
R&D j. (Matieland, Online) vol.24 Stellenbosch, Cape Town 2008
Sound Quality Metrics to Assess Road Noise in Light Commercial Vehicle
Joring von Gosier; Johannes L van Niekerk
Sound & Vibration Research Group. Department of Mechanical and Mechatronic Engineering, Stellenbosch University, South Africa. MSAIMechE, Professor, Director: Centre for Renewable and Sustainable Energy Studies. E-mail: wikus@sun.ac.za
ABSTRACT
This study investigated the interior sound quality (SQ) of light commercial vehicles (LCVs). In particular the road/tyre noise component was used to investigate the correlation of objective SQ metrics with subjective ratings of loudness and annoyance in order to develop benchmarks for SQ. Sound measurements were done in a selection of L CVs and two small sedans to obtain representative sounds quality. A16 member jury provided subjective evaluations of the measured sounds. The metrics, Zwicker loudness and Aure sharpness, were found to correlate strongly with vehicle speed as well as with the road surface roughness. Loudness and sharpness increases linearly with vehicle speed. Loudness was found to be around 25% higher and sharpness around 5.6% lower for vehicles driving on rough tar roads than driving on smooth tar roads. Good correlation was found between the subjective evaluation of annoyance and loudness and the calculated metrics of Zwicker loudness and Aure sharpness indicating that these two metrics can indeed be used as benchmarks when developing new models.
Nomenclature
DAT digital audio tape
FS Zwicker fluctuation strength
HATS head and torso simulator
fmod modulation frequency
LCV Light commercial vehicles
Ν Zwicker loudness
NVH Noise, Vibration and Harshness
Sh Aure sharpness
SQ Sound Quality
R2 correlation coefficient
R2all correlation coefficient for all vehicles
R2combined correlation for combination of Ν and Sh
R2FS correlation coefficient for fluctuation strength
R2LCV correlation coefficient for only the LCVs
R2N correlation coefficient for loudness
R2Sh correlation coefficient
1. Introduction
Noise, Vibration and Harshness (NVH) characteristics are becoming one of the key vehicle attributes in today's competitive automotive markets. Similar to good vibration and harshness characteristics, the perception of a vehicle's quality is enhanced by a quiet interior. Customers are not only expecting vehicles to be innovatively designed, sophisticated and powerful, but also to sound 'right'4,6. Sound Quality (SQ) engineers are currently focusing their attention on identifying objective metrics to evaluate the SQ as part of the NVH testing procedure. This allows for direct optimisation of the vehicle interior sound quality making use of SQ benchmarking. This study attempts to develop objective criteria to directly optimise the interior sound quality of light commercial vehicles (LCVs) on the South African market. The effect the noise produced by road/tyre interaction has on the interior sound quality of seven comparable vehicles was investigated in this study. This study focuses on the interior sound quality of LCVs influenced by road noise, as South Africa has some very rough tar roads (used for better drainage purposes), as well as a vast network of dirt roads. These rough road surfaces cause unpleasant driving experiences, especially when people travel long distances at constant high speeds.
Road noise contributes on average 28 % of the total noise in a vehicle cabin7. The interaction of road and tyre produces a rough, low-frequency and non-harmonic noise. Road noise is linearly dependent on vehicle speed and forms the dominant noise source in the medium speed range (80-120 km/h)7. Low frequency (around 100 Hz) booming noise is a major concern in the design of the cabin of ½ ton LCVs, which was investigated in a previous study by Wade and Van Niekerk8. This and other road dependent noise sources and their propagation into the cabin depend on a number of factors, such as the type, dimension, load and inflation pressure of the tyres, the type of suspension system, the vehicle speed, the dimension of the wheel arch and cabin, chassis stiffness as well as materials used for noise and vibration insulation. The interior sound quality in ½ ton LCVs has not been benchmarked to date.
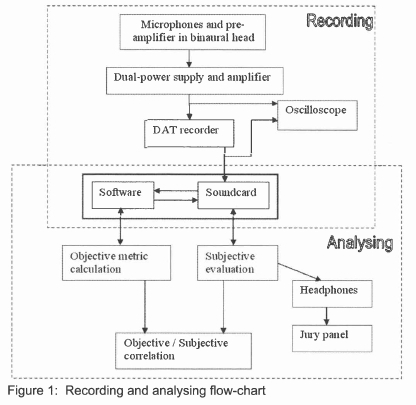
The sound quality (SQ) determination method used in this study consists of four steps. First is the recording of the sound of interest under operational conditions with the aid of a binaural head and torso simulator (HATS). Thereafter, a computer program is employed to calculate the objective sound quality metrics such as the loudness, fluctuation strength and sharpness of the recorded sound samples. Then customers' opinions and impressions of the recorded interior sounds are obtained by presenting a representative jury with the recorded sound samples. This is a time consuming, expensive but necessary procedure, as only a person is capable of deciding if a sound is acceptable to humans, and if it sounds 'right' for the specific product4,6 and 7. The final step and ultimate goal of the SQ procedure, is the correlation between the objective metrics and the subjective ratings of the tested sounds. A meaningful correlation enables the design engineer to rate the interior sound quality of similar vehicles with only limited jury tests, if any6.
The definition of sound quality (SQ) in this study covers: □ The quality of a sound, i.e. the subjective attribute a person associates with a sound, such as harsh, smooth, quiet, luxurious, annoying.
□ The suitability of a sound for the specific product, i.e. a sporty exhaust sound for a sports car, a deep engine growl for a V6 pick-up; and
□ The quality (value) perception of customers of the vehicle, for example how expensive, reliable or durable the vehicle sounds.
The SQ method as mentioned above refers to the actual method developed by vehicle manufacturers to determine their vehicle's sound quality. This method is discussed in detail in the following paragraphs and is depicted in figure 1.
2. Experimental Procedure
The influence of road / tyre noise on the interior sound quality of the test vehicles was investigated in this study in order to obtain a method to objectively optimise the interior SQ of future ½ ton LCVs. The sound of interest that was later subjected to testing was acquired by accelerating the test-vehicles down a medium decline (around -5°) rough-surfaced tar road. The gear lever was placed in neutral as soon as the vehicles reached the test-speeds of 60/80/100/120 km/h (speedometer) respectively, and the vehicles were allowed to run downhill freely, with the engine idling and the clutch released. Recordings were made for 15 -20 seconds, depending on how long the vehicles maintained the constant test-speed. All tests were performed with all windows fully shut and air conditioning, the ventilation fan and music off. All sounds that were not produced by interaction between the tyres and the road were eliminated as far as possible, in order to only investigate the influence of this noise type. An exception is wind noise that was still present.
The equipment and procedure used during the sound quality (SQ) evaluation is discussed in the next paragraphs. The SQ testing approach used in this study is a standard and widely accepted approach in SQ engineering3,5,6. It consists of the following four aspects:
I. Recording interior sounds with the aid of a calibrated binaural head and torso simulator (HATS).
II. Analysing the recorded sounds using software to calculate the objective SQ metrics. Objective metrics calculated in this study are:
a. Zwicker loudness [sone],
b. Aure sharpness [acum] and
c. Zwicker fluctuation strength [vacil]
III. Conducting jury testing (subjective evaluation) with a 16 member jury panel.
IV. Correlating the calculated objective metrics with the subjective evaluation to obtain an equation which can be used to directly optimise the interior sound quality of future ½ ton LCVs, without the use of jury testing.
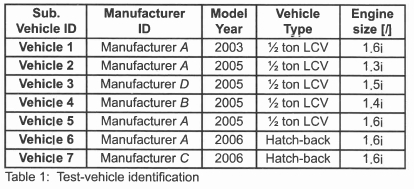
The test-vehicles investigated in this study are shown in table 1; all the LCVs were tested on roads in Pretoria, while the two hatch-backs were tested on roads near Stellenbosch. All test vehicles are powered by petrol engines.
2.1 Sound recording
After calibration and testing of the equipment, the binaural head and torso simulator (HATS) was placed on the front passenger seat of the test-vehicle. Recordings were made once the test-vehicle was travelling on the specified road section at the respective speed. To be able to record in remote places, all the equipment required to make the sound recording is portable and battery powered, as can be seen in figure 2.
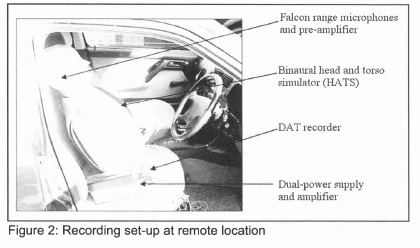
The binaural head and torso simulator (HATS) utilised in this study was built by Brüel & Kjaer and records sound signals via two very sensitive (50mV/Pa) condenser microphones situated inside the ear canals. The signal sensed at each microphone is amplified by built-in pre-amplifiers, which are connected to the microphones via an angle piece to simulate the human ear. An external dual power supply provides power to the two pre-amplifiers and allows further amplification of the recorded signal.
After the recorded signal is amplified, it is stored as a digital stereo sound on a digital audio tape (DAT) by a digital data recorder. The DAT recorder is a high precision signal acquisition device and can be set to sample at a number of frequencies (up to 40 kHz). In order to analyse the recorded data it is transferred from the DAT recorder to a personal computer hard-drive using a data acquisition box (SigLab for this study). The SigLab system was also used to transform the recorded data from a binary type file to an audio (wav) file using Matlab software. These wav files were then used by Matlab to calculate the objective metrics of the signals. The signals recorded on the DAT tape did not undergo any volume or sampling changes. The volume and sample frequency of the digital signals were set by the DAT-recorder-setting and remained unchanged for objective and subjective evaluation. The DAT recorder and Matlab sampled at a rate of 40 kHz, which is more than twice the highest frequency of interest (18 kHz).
2.2 Objective analysis
Following the sound recording, a section of the entire sound sample for each test condition was taken from the complete recording and edited using the audio-file (wav) editing tools in Gold-wave. The final sound samples which were then analysed in Matlab were set at 3 seconds long, as the first impression of the sound had to be investigated. As previously stated, Matlab was used to calculate the objective metrics of Zwicker loudness, Aure sharpness and Zwicker fluctuation strength of the recorded sounds. These three metrics are briefly described below.
Loudness is the subjective impression of the intensity and magnitude of sound and therefore belongs to the category of intensity sensations1,5. The loudness of a sound is a perceptual measure of the effect of the energy content of a sound on the ear. The manner in which the human mind determines loudness is very complex and highly non-linear, therefore factors such as frequency content, waveform and duration of the sound have to be considered when determining the loudness of a sound sample1.
The bandwidth of a sound is instrumental when calculating its loudness. Studies have shown that sounds with large bandwidth (5 kHz), but with identical Α-weight sound pressure levels are experienced up to 15 dB (A) louder than sounds with very small bandwidths (less than 100 Hz)1,5 and 7. Zwicker therefore proposed a summation of specific loudness, in [sone] per Bark, in order to determine overall loudness more accurately (ISO 532B). The Bark was proposed by Zwicker1 and is a division of the frequency spectrum, around 20% of centre-frequency, similar to ⅓ octave bands. The equation to determine Zwicker loudness, proposed by Zwicker, is given as equation (1) here.
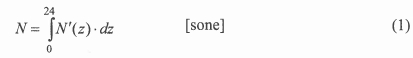
where N' (z) is the specific loudness [sone] per Bark (z).
The reference value of the sone scale, 1 sone, is a pure tone producing 40 dB at 1 kHz. For increasing loudness, the sone scale behaves identical to the subjective human ear: a doubling of its value for every 10 dB increase in sound pressure level (references1 and 5 give a more in-depth discussion). The B&K binaural head and torso simulator was calibrated using a pure tone producing 94 dB at 1 kHz, which is equal to 40.12 sone. Furthermore, Zwicker loudness [sone] was found to correlate well with subjective ratings and is considered the single most important metric in today's SQ analysis7 and 9.
Masking and the effect of exposure time to a sound must be considered carefully when analysing the Zwicker loudness produced by a sound, as high frequency content in a signal may be masked by its low frequency content1.
A signal with significant high frequency energy will typically sound more annoying than a signal with equal loudness, but without high frequency content. This high frequency content is called sharpness and may jeopardise the interior sound quality of a vehicle. Squeaks and rattles are major sources of increased sharpness in vehicle interior sounds5.
Sharpness is defined as the average pitch of a sound, and is the result of a sound's spectral makeup. The most important parameter influencing sharpness in a narrow-band sound is its spectral contents and centre-frequency1. The reference value for sharpness, 1 acum, is a tone producing 60 dB at a centre-frequency of 1 kHzb. Zwicker and Aure have both developed a formula for sharpness, but unfortunately they do not correlate well. Aure's method was chosen for this study, as it is was the preferred method in SSQTOOL and was found to correlate better with subjective evaluations than Zwicker 's method. The equation proposed by Aure to determine the sharpness of a sound is given as equation (2).
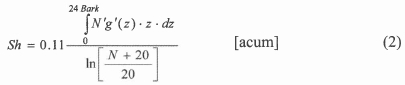
Equation (2) gives the sharpness (Sh) by summing the specific loudness (N' in [sone]) per Bark (z) divided by the total loudness (N). For equation (2) Aure proposed a variable g' (z) = e0.
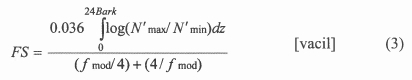
Fluctuation strength is created by relatively slow modulations and quantifies subjective perception of slower (up to 20Hz) amplitude modulation of a sound1. Fluctuation strength (FS) may result from variation and modulation of sounds, either in loudness or in frequency11. There are three types of fluctuation strength: amplitude modulated broad-band noise, amplitude modulation of pure tones, and frequency modulation of pure tones. Amplitude modulation of broad-band noise represents the effects found in vehicles the best11.
Fluctuation strength can be computed by an equation developed by Zwicker1, in terms of modulation frequency fmod(Hz) and specific loudness N' (in [sone] per Bark (z)). From equation (3), it is apparent that fluctuation strength increases quite significantly for an increase in specific loudness. 1 vacil is defined as a tone of 60 dB at 1 kHz which is 100 % amplitude-modulated at 4 Hz.
2.3 Subjective evaluation
A jury panel consisting of 16 members was chosen to represent the average customer of today's LCVs. A Matlab program was used to present the jury panel with a number of sound samples to be evaluated with respect to different attributes. All jurors in a given panel were presented with an identical sound for the same time, as the stimuli came from a single computer and were distributed to the jury via a headphone amplifier and headphones. This is known as a paced jury set-up, as all jury members were presented with the identical sound pair, at exactly the same time and had an identical time span to respond. This method has the advantage that a bulk of sounds can be compared within a short time without risking juror fatigue as the operator also controls the time between presented sound pairs. However, jury member were allowed sufficient time, around 4 seconds, to make their decisions. Jurors participated in two evaluation procedures and were asked to mark their choices on the specific answer sheets provided.
Each jury panel was provided with an identical set of instructions and an answer sheet for both subjective evaluation methods. Each method was explained and a short description of the sounds that were to be presented to the jury was given to them prior to the tests. No particular vehicle or manufacturer names were mentioned to the jury, to avoid brand bias. A short hearing test and an identification task were conducted for each juror individually, to investigate if subjects had an average to above-average hearing capability. At the start of each subjective evaluation test, a few sound samples were presented to the jury first, to familiarise them with the sort of sounds they could expect to hear.
The listening room was kept at a pleasant temperature of approximately 22°C, with low humidity and adequate ventilation for the convenience of the jury. Care was also taken to remove all disturbing environmental sounds from the listening room, as these disturbing sounds may have an unforeseeable effect on jurors during sound evaluations3. The signals to be subjectively evaluated were broadcast to the jury by headphones as this eliminates the effect that room acoustics and juror position have on the presented sound. It also has the advantage that jury members cannot disturb one another easily.
The two subjective evaluation procedures chosen were the forced choice paired comparison test and the semantic differential rating test, to obtain representative results for the correlation with the objective metrics. These were recommended by literature3,5 and were found to provide good correlations with the objective metrics.
The forced choice paired comparison test was the first test each jury panel had to complete, with jurors only having to decide if they preferred sound A or B. An advantage of this method is that a large number of sounds can be compared in a short time, as the evaluation process is straightforward and quick. However, a disadvantage of the paired comparison test procedure is that it only reveals the overall preference of a certain sound, with no indication of the margin by which it was preferred over other sounds.
For the semantic differential evaluation, jurors had to evaluate sound samples from the test vehicles for three specific criteria. They had to evaluate these different sounds by marking levels on unmarked scale lines, rating the sounds according to a question such as: "How irritating is this sound to you". The line was then marked with attributes at the two extremes such as "very irritating" and "not irritating". The reason the evaluation lines were unmarked is because jurors tend to restrict themselves if demarcations are supplied. As sounds were rated sequentially, subjects tended to avoid the extremes for the current sound, in case an upcoming sound would be even better (or worse). To limit this, the first sound of each test condition was chosen to have objective metrics that were midway in the field, so that it served as a reference sound. For example, the interior sound of vehicle 3 for the 100 km/h test in figure 3 was chosen as the reference sound for the semantic differential test 2.
The Zwicker loudness (TV) as well as Aure sharpness (Sh) were spread over a wide range (45 - 60 [sone] and 1.67 - 2.3 [acum] respectively), making the sound samples suitable for semantic differential evaluation, as this makes the behaviour of a certain objective metric easier to investigate. Fluctuation strength could only be calculated for the smooth road test, as this metric tends to "boom out" for sound samples recorded on rough road surfaces, at high speeds (the Matlab software could only calculate FS of up to 0.5 [vacil]).
2.4 Correlation procedures
The correlation between the objective and subjective analysis forms the final step in the sound quality (SQ) procedure. Both subjective evaluation methods were first correlated against single objective metrics, such as Zwicker loudness and Aure sharpness. Then the subjective ratings were correlated against a combination of these two objective metrics, in order to obtain a stronger correlation than a single metric could provide. These combined correlations could ultimately be used to optimise interior SQ and set target values for the interior sound quality of future LCVs.
For the paired comparison evaluation method the sound samples from the different vehicles were rated by evaluating the number of times that particular sound was preferred over the others, relative to the number of times the sound was presented. These ratings for the different sound samples were then correlated with the objective metrics evaluated for these sounds. Linear regression was employed to provide a mathematical relationship between the subjective and objective evaluations for the different sound samples. A straight-line correlation was found to approximate the tendencies of the data well. The correlation coefficient (R2) was calculated to determine the accuracy of this linear fit in relation to the actual experimental data.
The subjective ratings from the semantic differential evaluation method were also correlated with three objective metrics (N, Sh and FS). As expected, Ν and Sh were found to give stronger correlations than obtained for the paired comparison test correlations. This was expected because subjects could rate how much a given sound sample was preferred to another one, which is impossible in the paired comparison evaluation. However, FS was found to only correlate weakly with subj ective evaluations (R2FS ≈ 0.2).
3. Test Results, Discussions and Correlations
The results found in this study are displayed and discussed under the sections of the SQ procedure, being:
□ Objective SQ metrics
□ Subjective evaluation
□ Objective / Subjective correlation
All objective results were obtained utilising a Matlab based software package. The total loudness (N) calculated by the software is based on Zwicker's method of determining the specific loudness (Ν') per Bark (z) and summing these, as discussed under objective analysis in section 2. The loudness calculated by Matlab is based on a diffused sound field, which is used for areas where the binaural head and torso simulator (HATS) is surrounded by many sound reflecting surfaces, as in a vehicle cabin. However, this setting overstates loudness values, if compared with the free sound field setting.
The sharpness (Sh) value calculated by Matlab is based on Aure's method for sharpness, as it correlates better with subjective ratings than Zwicker's metric6. This method amplifies higher frequency noises, as they are subjectively experienced as more irritating1,5.
Fluctuation strength (FS) calculated by Matlab is based on Zwicker's model. However, it is found to only correlate very weakly with subjective ratings (R2FS ≈ 0.2) and was therefore omitted from extensive investigation and target setting procedures.
3.1 Objective SQ metrics
Loudness and sharpness were observed to be very stable over the recording time. It is therefore believed that, for instance, tenth percentile loudness (N10) would not correlate better with subjective ratings than the average loudness, as was suggested by12. The same cannot be said about fluctuation strength (FS), as it varies strongly over its recording duration.
The two hatch-back vehicles (vehicles 6 and 7) were tested on roads near Stellenbosch, while all LCVs (vehicle 1 to 5) were tested on Pretoria's roads. Very similar results were found for the tests conducted in Stellenbosch and Pretoria. The objective results of the two hatch-backs were adjusted to ensure that these are directly comparable to the results of the LCVs. However, these adjusted values for the two hatch-backs may not perfectly match the results that would have been obtained if these vehicles were physically tested on roads in Pretoria.
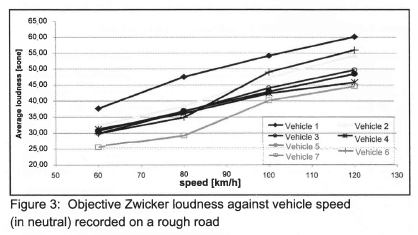
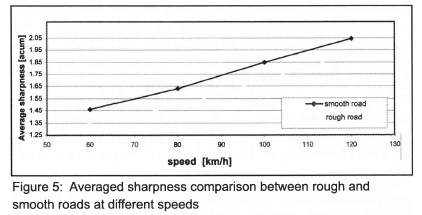
A strong correlation between objective metrics and vehicle speed was found in this study. This is illustrated in figures 3 and 4 for Zwicker loudness (N) and figure 5 for Aure sharpness (Sh). Both metrics increase more or less linearly with an increase in vehicle speed. This result was expected and is confirmed in article7. Overall, the gradient of the loudness/vehicle speed graph was found to be +2.5 sone/10 km/h and the sharpness/vehicle speed figure was +0.1 acum/10 km/h, starting from the 60 km/h test. FS was found to be less dependent on vehicle speed.
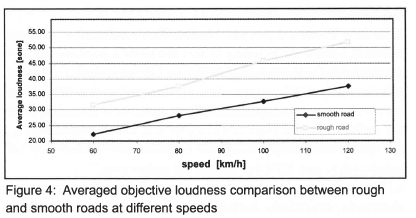
The average loudness for vehicles travelling on the rough roads is on average 25.6 % higher than for those driving on the smooth test-road, as depicted in figure 4. This indicates the strong influence road surface has on the interior sound quality of vehicles, also discussed in7. This result can be explained by noting that the road/tyre interaction is more forceful on these rough roads, as the road texture is very uneven, and therefore produces a louder sound.
Figure 5 displays the effect different road surfaces have on the Sh of the vehicles' interior sounds. On average, sharpness was found to be 5.6 % lower for vehicles travelling on the rough roads compared to a smooth road surface. This result was expected, as the rough road has a less frequent interaction with the test vehicle tyres, resulting in a lower frequency noise, which produces lower sharpness.
Squeaks and rattles (S&R) were found to strongly increase the sharpness value in a sound recording. Therefore, extreme care was taken in eliminating any S&R during sound recordings for SQ purposes. This strong dependence of Sh on S&R offers a possibility for vehicle manufactures to check for S&R in their prototype vehicles. Reducing S&R will improve the overall quality impression of any vehicle on a potential customer.
Throughout the test conditions, while it was observed that all vehicles produced the same tendencies for Sh, there was not a single vehicle that continuously performed strongly for this metric. This indicates that it is much more difficult to benchmark a metric for sharpness than loudness, as not even the hatch-back vehicles are capable of producing better results for this metric.
As was expected, fluctuation strength (FS) proved to be inconsistent for all the tests. It was found to vary greatly between tests as well as within the few seconds of testing time. However, it can generally be concluded that FS is lower for smooth roads and lower vehicle speeds. Overall, hatch-back vehicles were found to produce interior sounds with lower FS, indicating a superior interior sound quality to that of the LCVs.
Generally, LCVs produce interior sounds with higher loudness values than hatch-back vehicles. Vehicles 1 and 7 are observed to be outliers for all conditions in terms of loudness (N), but for very different reasons. Vehicle 7, a more expensive hatch-back, consistently performs best, as it is in a different category to where the normal LCV can compete. This vehicle could be used to provide benchmark directions for future LCVs, especially in terms of Zwicker loudness. (Vehicle 6, a more sporty, hatch-back could be used as a sharpness benchmark for future LCVs.) Conversely, Vehicle 1, an older LCV (with 60 000 km on the odometer) is by far the worst performer in terms of Ν in this comparison. This is because it is the only older vehicle which means that some squeaks and rattles (S&R) are already present in the vehicle interior, as door seals and other sound insulators are already showing signs of wear and tear. It was only included in this study as it forms the base-line model for these tests.
3.2 Subjective evaluation
The forced choice paired comparison evaluation method presents a good opportunity to test the juror's consistency and repeatability during these SQ analyses. The jurypanel, consisting of 4 females and 12 males chosen for this evaluation, performed very well in these categories. Only two jurors, both males, were not included in the final correlations due to low repeatability; the rest of the group managed a respectable 84% average for repeatability and 92% for consistent judgments.
Some differences between male and female jurors were observed, particularly during engine noises evaluations. Men generally preferred the low frequency grumbling engine sounds, while women generally preferred the very quiet engines, or the higher pitched less audible engine sounds.
3.3 Objective / Subjective correlation
In figures 6 to 9, subjective ratings of a zero (0) for Annoyance indicates that this sound was the most preferred sound in the particular category, compared to a rating of a one (1) indicating a very irritating, disturbingly loud or unpleasant sound, which was rated poorly by the jury.
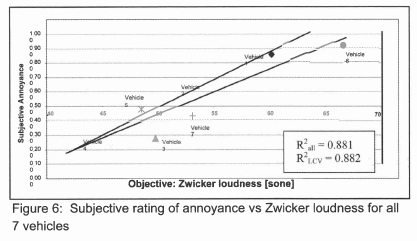
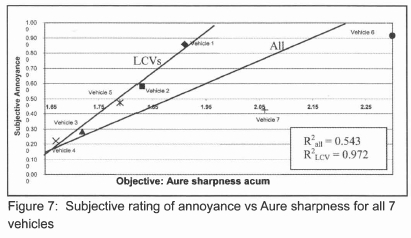
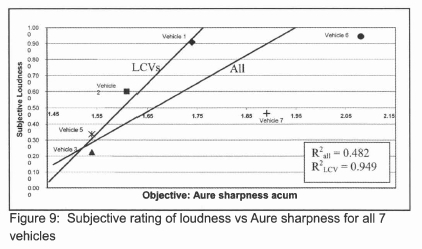
It can clearly be observed from figure 6 and 7 that the correlation between subjective evaluations and objective metrics slightly improved if only one type of vehicle is compared. R2all refers to the correlation found if all seven test vehicles were included, whereas R2LCV indicates the correlation achieved when only the five LCVs were compared.
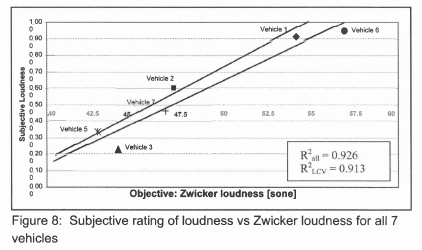
A strong correlation of Zwicker loudness (N) and Aure sharpness (Sh) with subjective ratings was found for both evaluation methods. Correlation of ≈ 0.70 was achieved for the paired comparison tests and correlations for the semantic differential evaluation were found to be even stronger at R2combined ≈ 0.79, R2N ≈ 0.88, R2sh ≈ 0.6. Still stronger correlations were observed for both evaluation methods, when only the LCVs were considered (R2combined ≈ 0.94, R2N ≈ 0.88, R\ ≈ 0.98) for the semantic differential test. This is shown in figures 6 to 8. These finding were expected, as each type of vehicle will have a certain range in which objective metrics will lie and will produce a typical type of sound. The main finding of this study - that of Zwicker loudness (N) being the single most influential objective metric in SQ engineering today and Aure sharpness (Sh) the second most influential metric - corresponds with other literature findings7,9 and 12.
To better compare the results of this study to previous findings, the correlation's y-axis in figure 6, labelled subjective preference, was intercepted at 0.5 (50%), to visually separate unpleasant sounds (0.5-1) from the ones rated as pleasant (below 0.5). The correlations for the semantic differential evaluations tend to be stronger for most test conditions. As stated before, this is because jurors can actually rate how they prefer a certain sound compared to others.
Fluctuation strength (FS) was, at best, found to be a guideline. FS tends to be lower for lower vehicle speeds as well as for higher quality interior sounds. Rough roads and aerodynamic noises tend to increase FS and jeopardise the sound quality of the vehicles' interiors. Correlation between FS and subjective ratings is weak (R2FS < 0.4), and therefore it can only be used to give a rough indication of subjective perception.
As previously mentioned, it was decided that only the results from the semantic differential evaluation procedure should be used to develop an equation to predict future subjective response to a given interior sound. This is due to the fact that the two methods provide similar results, but the semantic differential test provides better correlation between the subjective evaluations and the objective metrics.
4. Conclusion and Recommendations
A strong correlation between vehicle speed and the objective SQ metrics of loudness (N) and sharpness (Sh) were observed in this study. Fluctuation strength (FS) was the third objective metric investigated, however only a weak correlation between vehicle speed and this metric could be found. These findings are in agreement with previous research findings6,7,9 and 12.
A strong influence of road surface roughness on the interior sound quality of a vehicle was also found in this research. The different effects of smooth and rough tar roads on the interior SQ of the test vehicles have been investigated. The rough road surface was found to produce interior sounds with around 25 % higher loudness and 5.6 % lower sharpness values than the sound produced when driving on a smooth road. This tendency is also supported by literature7.
Zwicker loudness was found to correlate well with both subjective loudness and annoyance while Aure sharpness only correlated well with both subjective loudness and annoyance when the data from the two hatchback vehicles were excluded. This seems to indicate that sharpness should be used with greater care than loudness when used as objective metrics.
It was found that it is very hard to link certain sound quality attributes to physical vehicle components. Linking these two aspects has been the focus of other studies, all of which found that linking these two aspects is only feasible if one focuses on very specific vehicle hardware, such as the exhaust or the tyres. For these specific cases, the design engineer should be able to predict what effect a certain modification on this specific component will have on the vehicle's interior sound quality7,9.
This work showed that it is possible to use loudness (N) and sharpness (Sh) as reliable metrics to predict overall subjective evaluation of the sound quality of LCVs. Therefore these two metrics can be used to set benchmarks in the vehicle development process when a new model is developed and positioned relative to its predecessor and competitors in the market.
References
1. Fast, H and Zwicker, E, Psychoacoustics, 2nd edition, Springer-Verlag, Berlin, 1999.
2. Kinsler LE, Frey AR, Coppens AB and Sanders JV, Fundamentals of Acoustics, 3rd Edition, John Wiley & Son, New York 1982.
3. Amman S, Eaton C, Lake S and Otto N, 1999, Guidelines for Jury Evaluations of Automotive Sounds, SAE Noise and Vibration Conference, SAE ref: 1999-01-1822.
4. Anon, The Binaural Approach to Better Sound Quality, Noise and Vibration Worldwide, 1995, 26, 13 - 17. [ Links ]
5. Davies P and Ebbitt G, 1998, The Role of Sound Quality Assessment in Noise Control Engineering, Proceedings-National Conference on Noise Control Engineering, 23-28.
6. Feng BJ, Otto NC, Wakefield GH, Sound Quality Research at Ford - Past, Present and Future, Sound and Vibration, 1998, 32, 20 - 24. [ Links ]
7. Iwoao K and Yamazaki I, A study on the mechanism of tyre/ road noise, April 1996, JSAE Review, 17, (2), 139 - 144. [ Links ]
8. Wade AD and van Niekerk JL, Investigation into road rumble in a light utility vehicle, R&D Journal, November 2005, 21, (3), 8-13. [ Links ]
9. Jorro S and Tambini A, The Laboratory simulation of tyre noise, 2000, SAE papers ref: SAE 972048.
10. Head Acoustics product literature and data sheets by Brüel & Kjaer, http://www.bksv.com, [May 2005].
11. Blommer M and Otto N, New way to calculate fluctuation strength in electric motors, 2001, SAE papers ref: SAE 2001-01-1588.
12. Ingham R, Otto N and McCollum T (Ford Motor Comp), 1999, Sound Quality metrics for Diesel Engines, SAE papers ref: SAE 1999-01-1819.
Received 11 May 2007
Revised form 1 October
Accepted 3 October 2007
b SSQTOOL is a propriety suite of MATLAB routines develop by Ford Research Laboratories to calculate the different SQ metrics
