


Services on Demand
Journal

Article
 English (pdf)
 Article in xml format
 Article references
 Send this article by e-mail
Indicators
Related links
-
 Cited by Google
 -
 Similars in Google
Share

 Permalink
R&D Journal
On-line version ISSN 2309-8988Print version ISSN 0257-9669
R&D j. (Matieland, Online) vol.31 Stellenbosch, Cape Town 2015
Improved Cover Type Header Box Design Procedure
W BeyersI; A ZapkeII; G VenterIII
IStellenbosch University. Stellenbosch, South Africa. Email: wilhelmbeyers@gmail.com
IIGEA Aircooled Systems (Pty) Ltd. Germiston, South Africa. Email: albert.zapke@gea.com
IIISAIMechE Member. Stellenbosch University. Stellenbosch, South Africa. Email: gventer@sun.ac.za
ABSTRACT
The purpose of a heat exchanger header box is to act as a high pressure manifold that redistributes process fluid from a central source to a bundle of finned tubes where it can be cooled. Due to the lack of certified cover type header box design codes, industrial manufactures are left to develop their own in-house codes. This paper presents an investigation of an in-house design code and compares its results with those from finite element analyses. After analysing multiple sample designs, it was found that header boxes designed using this method were all over-designed. To address this problem, a new 2D finite element software package was developed, based on an open source platform, and validated to accurately analyse cover type header boxes. The software can be used to validate any existing designs, as well as to provide an optimal design and accurate stress predictions for new header boxes, thus reducing uncertainty in the design process.
1 Introduction
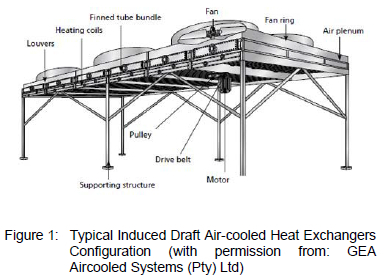
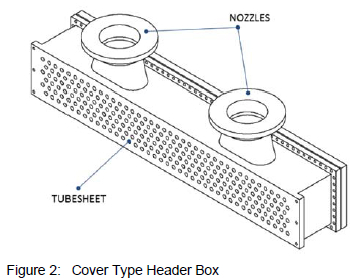
The focus of this research is to investigate and improve the methods used to design cover type header boxes for air-cooled heat exchangers. An air-cooled heat exchanger is a device that rejects heat from a process fluid directly to ambient air. By construction, it is a vessel that removes heat from a process fluid by forcing cool ambient air over a collection of finned tubes through which the fluid is flowing. Figure 1 shows a typical layout of an induced draft air-cooled heat exchanger. Hot process fluid is pumped into an inlet header box, which channels the fluid into the finned tubes. Here the fluid flows through the tubes and into an outlet header box before exiting through an outlet nozzle. Simultaneously, cool air is blown over the finned tube bundle by a fan to accelerate the exchange of heat between the air and the fluid in the tubes. The purpose of the heat exchanger header box is to act as a manifold. For the header box shown in figure 2, process fluid will flow into the two large nozzles and out through the holes in the tube sheet. The two most commonly used header box designs are the removable cover and the plug type header boxes.
1.1 Plug Type Header Box
Figure 3 shows a diagram of a plug type header box layout. The header box consists of six metal plates welded together at all the seams to form an enclosed box. For every hole drilled in the tube sheet, a corresponding hole is drilled in the plug sheet. During the construction phase the plug sheet holes are used as access ports to weld the finned tubes to the tube sheet. While the box is in service each hole is fitted with a screw in plug, which can easily be removed to gain access to the insides of the finned tubes and the header box itself for inspection and cleaning.
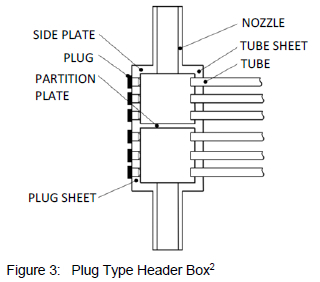
The plug type header box provides a stronger and more rigid structure as compared to the cover type header box. This allows the plug type header box to operate at pressure ranges exceeding 3 MPa 1. The drawback of this header box design is however that the small size of the plug holes complicates inspection and cleaning of the system, especially the inside of the header box itself.
1.2 Cover Type Header Box
Figure 4 shows two cover type header box configurations. In both designs the header consists of five metal plates welded to form an open box. A matching flanged cover plate is then fastened to the assembly to complete the box. The only difference between the two configurations is that the tube sheet changes from being part of the welded section of the box to being integrated with the cover plate of the box.
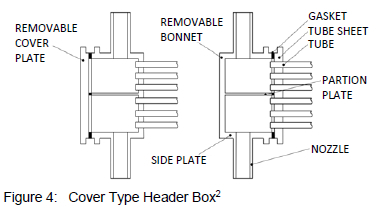
This design allows for the removal of one entire side of the box. This simplifies manufacturing, inspection and cleaning processes. However, the design is less rigid compared to the welded joints of the plug type header and is thus limited to a lower operational pressure range.
1.3 Motivation
When a plug type header box needs to be designed, the process is fairly simple. The majority of the rules and formulae needed for the design are available in Division 1 of Section VIII in the American Society of Mechanical Engineers' (ASME) design code3. This is not the case for cover type header boxes. Even though the code provides rules for the design of a large array of pressure vessels, the complicated geometries of the cover type header box make it difficult to describe their design requirements by a set of simple rules. For this reason, manufactures have developed in-house design codes, to focus specifically on the design of cover type header boxes. These codes draw primarily from ASME Section VIII, but also include considerations from API Standard 6611.
In order to advance the development of cover type header box design methodologies, an industrial manufacturing partner, GEA Aircooled System (Pty) Ltd, commissioned this study to investigate the overall process of how cover type header boxes are designed. The focus of the study was to evaluate the current design methods being used, implement changes to improve the current header box design process and quantify the optimisation potential of the current header box design process.
2 Current methods
South African law mandates through the Pressurised Equipment Regulations4 and South African National Standard 3475, that new pressure vessels designed to operate under an internal pressure equal to or greater than 50 kPa(g) have to be categorised according to their Fluid and Pressure-times-Volume risk. All categories other than sound engineering practice (SEP) shall be designed and manufactured to an accepted Health and Safety Standard design code.
A widely used design code is the ASME Boiler & Pressure Vessel Code Section VIII3, here after referred to as 'the Code'.
Division 1 of the Code provides a set of rules that need to be followed for the satisfactory design of a variety of pressure vessel components. This method is known as "Design by Rule". As mentioned, for the case of designing a cover type header box however, the Code does not provide a complete set of design requirements. Instead, designers are required to design all components not covered by the Code using methodologies "as safe as" the rules in Division 1. These designs must then be submitted to an Approved Inspection Authority for approval, in order for the design to be deemed satisfactory.
In order to analyse the complicated geometry of cover type header boxes, designers have sought to divide the header box into a collection of simple geometries and then perform strength calculations based on these. For this to happen several simplifications are made:
• For the purpose of calculating the stress in the side plates and tube sheet, the stiffness of the end plates and nozzles are ignored.
• A 0.5 efficiency factor is used for calculations involving the side plates to account for the weakening caused by nozzle holes.
• The side plates and tube sheet are each treated as simply supported beams.
• Holes in the tube sheet are accounted for by a perforated plate ligament efficiency factor.
• Only internal pressure and bolt loading is considered.
• Bolt-induced bending moments are applied uniformly throughout the entire structure of the header box.
• Bending moments are applied to the ends of the side plates and the tube sheet to simulate that they stay at 90° to one another.
The free body diagrams, which result from these assumptions, for the header box under the conditions of bolt loading, Wj, and pressure loading, P, are shown in figures 5 and 6. Additional symbols in these diagrams indicate where these loads act and what internal reactions are present in the structure.
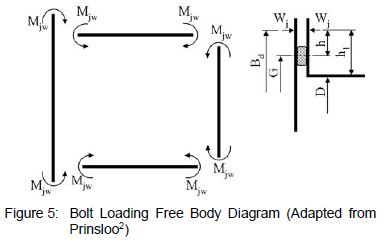
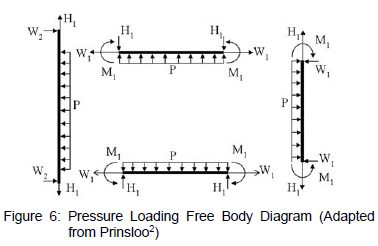
Based on these free body diagrams, stresses are calculated at various critical points in the header box's frame and compared to a set of failure criteria which will determine whether the header box design is acceptable.
Another method used to design the header box components not covered by the Code, is rigid frame analysis. Further details of this method can be found in Prinsloo2.
3 FEA Work
The first step in validating the current design procedure and searching for possible areas to improve the overall design process was to construct a complete finite element (FE) model of a header box. The benefit of a complete FE model is that it not only allows the user to make sure that the structure is strong enough, but also because of the visual nature of the results, helps the user understand how the structure will behave under loading.
3.1 FE Model for Benchmarking
To begin with, a 3D linear FE model of a complete header box was considered. The dimensions of the model were taken from a header box design provided by a manufacturer, for which an industry FE analysis report was also available. The purpose for constructing this model was to create a baseline of results which could be compared to the results of the industry report in order to establish a benchmark for the modelling techniques and assumptions to be used in this study.
3.1.1 Assumptions and Simplifications
When constructing an FE model, it is not always practically possible or necessary to consider every detail that is present in the real structure. Care must however be taken to ensure that the assumptions made are either conservative or still allow for the real component to be simulated accurately. The simplifications and assumptions used for this model are:
Simplifications
•Weld geometries were not included
•The structural effect of the tubes welded to the tube sheet were ignored
•Bolts can be replaced with equivalent forces at their contact areas
Assumptions
•The gasket stays in contact with the flange and cover plate at all times
•Pressure loads within the nozzles and finned tubes can be replaced with equivalent distributed loads at the openings These assumptions are similar to those used in the industry report.
3.1.2 Results and Comparison
A linear model was built and analysed using MSC.Patran 2012 as pre- and post-processor and MSC.Nastran 2012 as the solver. The model is comprised of 701 597 second order tetrahedral elements. A Young's modulus of 190.5 GPa was used for all header box components, including the gasket, as in the industrial report with which the results were compared. Using this material property for the gasket was seen as an acceptable simplification because in reality the gasket exhibits highly non-linear structural behaviour. Thus if any other material properties were used to model its structure in this linear analysis, the results would not necessarily be more accurate. A sample of the results obtained is compared with those of the industry report in figures 7 and 8.
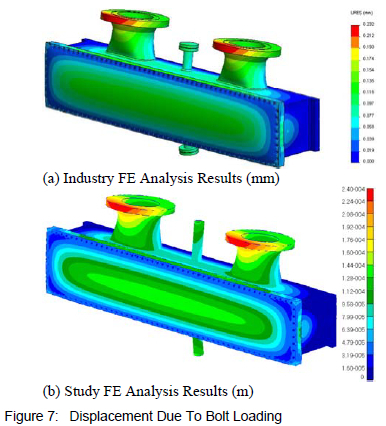
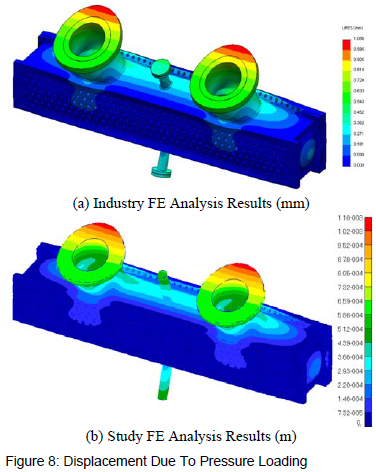
Figure 7 shows the displacement contour plot for the load case when only bolt loads are applied. It can be seen that the contour patterns for both sets of results match. In addition, the maximum numerical displacement results of the study's model differ by only 3.3 % from those of the industry model. Figure 8 shows the displacement contour plot for the load case where only the loads related to the internal pressure of the box are applied. This includes the nozzle and tube sheet loading and thus comprises the remainder of the loads which were not applied in the bolt loading case. Once again, the contour lines have the same pattern and the numerical results match within 1.3 %.
In order to benchmark the model considered here, only these two load cases needed to be compared. This is because any subsequent results needed from the model will be comprised of a linear combination of the results of these two load cases, as bolt and internal pressure are the only load inputs that can be independently modified. On account of these results, the overall modelling techniques and assumptions were shown to be in line with industry standards, and could therefore be used as the basis for any further FE work in this study.
3.1.3 Discussion
In the model used for benchmarking, inlet nozzles and individual tube sheet holes were both included. This was done so that an equivalent model could be compared to the FE report available. These features do not form part of the scope of this study, as they do not form part of the primary areas of attention of the methodology currently being used for the design of cover type header boxes. Current practice concerning these components is to validate the design of the nozzles and their interface with the header box using a 3D FE analysis and to account for the holes in the tube sheet by including a ligament efficiency, as prescribed by Mandatory Appendix 13, Paragraph 13-6, of ASME Section VIII Div 13, into the relevant calculations regarding the tube sheet.
Once these features are removed, the header box becomes symmetric along its length and breadth. It is therefore only necessary to model a quarter of the header box, which greatly reduces computational time.
3.2 3D Non-linear Model
The only way to know for certain where the header box is weakest is to construct a non-linear FE model which allows the user to track the progress of plastic deformation in the header box.
For this study, the key difference between the linear and non-linear FE is that the non-linear model takes material weakening due to yielding and plastic deformation into account. A non-linear FE model works by breaking up the load applied to a model and applying it incrementally. After each increment a new stiffness matrix is set up for the structure which accounts for the weakening of the structure in areas where the yield stress has been exceeded in previous increments. For a more thorough description refer to Zienkiewicz and Taylor6.
When tracking the plastic deformation predicted by this model, it is possible to differentiate between two possible scenarios that may occur at points where a high stress concentration is found.
In the first, the material near the point experiencing the high stress starts to deform plastically. As this happens, the stresses around that point are redistributed and in the process the stress values reduce to a level at or below the yield strength of the material. The plastic deformation is therefore halted and there is no plastic collapse of the structure.
In the second scenario, the same process takes place, whereby a point under high stress starts to plastically deform. In this instance however, the stresses redistribute, but still remain at levels above the material yield strength, or are redistributed in such a manner that new stress concentration points are formed where the stresses are also above the material yield strength. This leads to further plastic deformation in the structure and in turn starts a cascade effect, which may lead to the eventual plastic collapse of the structure. The point where the largest degree of this structural behaviour is observed is likely to be the point where the structure will fail first.
In the following section, a non-linear model of the header box in question will be analysed, in order to find the point on the header box where failure will occur first.
3.2.1 Non-linear Material Properties
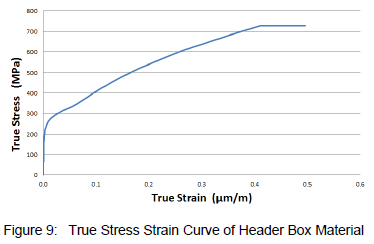
In order to accurately predict plastic deformation and material weakening, true stress-strain material properties need to be included in the model. Annex 3-D of ASME Section VIII Division 23 provides the necessary equations to set up the relevant material model. The stress-strain behaviour predicted by this material model for the header box material is shown in figure 9.
3.2.2 Results
The non-linear model was built and analysed using MSC.Mentat 2013 as pre- and post-processor and MSC.Marc 2013 as the solver. Von Mises yield criteria was used to detect material failure and the isotropic hardening rule was used. The model was constructed with 168 529 second order tetrahedral elements. The results of this analysis are shown in figure 10.
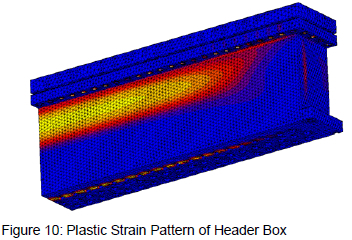
The plot shows the plastic strain pattern of the header box. In order to see this pattern, a load 6 times larger than the design load was applied to the header box. This was done to ensure that a significant level of plastic deformation would take place, in order that it could easily be visualised. Blue (dark colours) represents the area least affected by plastic deformation leading through to yellow (light colours) which indicates the area most affected by plastic deformation.
The results suggest that the critical region on the header box is located on the central cross-section of the box, furthest away from the support of the end plate, as the highest level of plastic deformation is found here. This behaviour is seen on both the side plate and tube sheet.
3.2.3 Discussion
From these results, it can also be deduced that if a header box was infinitely long, the strengthening effect of the end plates would be negligible at the centre of the header box. The resulting stress from a header box model where the end plate structure is ignored will then also necessarily yield a conservative prediction of the stresses in the side plates, cover plate and tube sheet. This is deduction is in line with the findings in literature7,8.
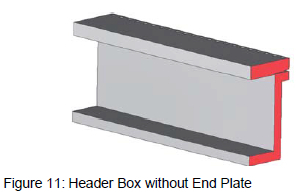
Furthermore, because a header box without an endplate is essentially a prism, as seen in figure 11, it is safe to assume that a full 3D model of a header box can be substituted with a 2D model of the header box's cross-section for the purpose of ensuring the structural integrity of the header box's side plate and tube sheet.
3.3 2D Model
The main purpose of analysing the header box structure using FE methods was to evaluate the results of the in-house design method used by this study's industrial partner. This in-house design method is comprised of a set of explicit analytical equations, which can be solved by hand, to predict the stresses in the header box. For this study, only the analytical calculation methodology pertaining to the side plate and tube sheet are to be validated, as design of the remaining parts of the header are already covered to a sufficient extent in the ASME and other accepted design codes. For this purpose, the 2D FE model provides the perfect solution.
Even though the 2D equivalent model of the header box is far simpler than the 3D model, it still provides all the results necessary for analysing the side plate and tube sheet at their critical loading conditions. At the same time, using the 2D model greatly reduces the computational time needed, from multiple hours for a 3D model to less than a minute for a 2D model.
3.3.1 Boundary Conditions
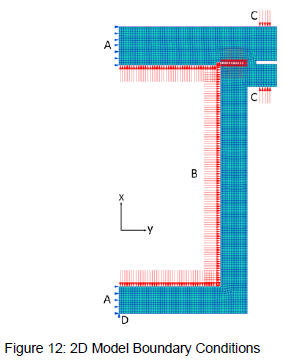
The 2D model consists of half the cross-sectional profile of the header box, meshed using plain strain elements. The boundary conditions applied to the model are shown in figure 12. A is the boundary condition that enforces the effect of symmetry in the model. All of the nodes along the line of symmetry are constrained from moving in the y direction. B is the equivalent pressure load applied to the inside of the header box and C is the equivalent bolt loads that are applied to the exterior of the header box. Because the bolt geometry is not defined in the 2D model, the bolt loads are applied as a distributed edge load over the portions of the cover plate and flange where the bolt holes would have been situated. Leaving out the bolt geometry was considered an acceptable simplification as the bolt holes are situated far enough away from any point where results will be extracted. D is where the model was constrained from moving in the x direction at a single node, to prevent a rigid body motion of the FE model.
3.3.2 Results Processing
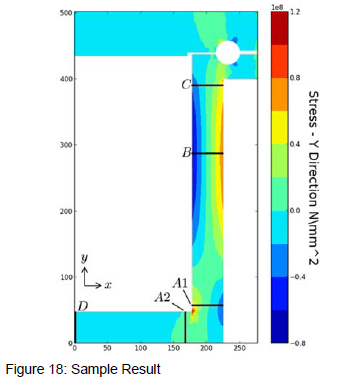
The guidelines for analysing the results of the FE model are given in ASME Section VIII Division 2 Part 5. The guidelines call for the linearisation of stress results at specific critical positions throughout the structure in order for the bending and membrane stresses to be calculated at these points. The positions where this is done are called stress classification lines (SCL). For the structure in question, figure 13 shows where relevant SCL need to be positioned.
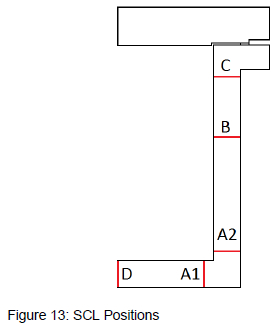
A1, A2 and C are positioned at the toe of the welds joining the tube sheet, side plate and flange. The results at these points will check whether the header box joints are strong enough. D is placed at the centre of the tube sheet and B is placed at the point along the side plate that experiences the highest combination of membrane and bending stresses. These SCLs check that the tube sheet and side plate will be strong enough.
The method used for performing stress linearisation is illustrated in figure 14. The figure shows how the stresses in the local y direction, which are perpendicular to the SCL, need to be linearised in order for the membrane and bending stresses to be calculated. The "Peak" stress component in the picture is not relevant in the context of this project as it is primarily used for fatigue failure calculations. The formulae used to perform the numerical calculations of the membrane and bending stresses are given by equations 1 and 2 respectively. In these equations, σy represents the stress values at the nodes along the SCL in the local y direction and t represents the thickness of the structure along the local x direction.
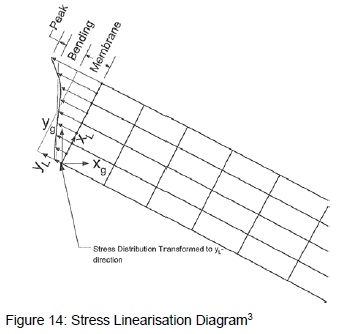
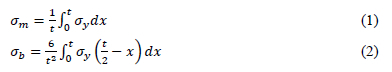
Table 1 shows the relevant failure criteria that the calculated stress values should be compared to, where σ1, σ2 and σ3 are the three principle material stresses, ,S is the allowable material stress and Syield is the material yield stess at operating temperature, specified by ASME.
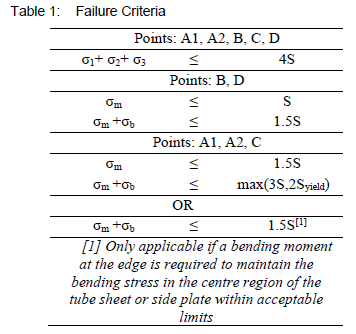
The exception in this table practically means that if the tube sheet or the side plate is not strong enough to support the loading placed on it, without any support from the joints it is connected to, the combined stress at that joint will be subject to stricter failure criteria.
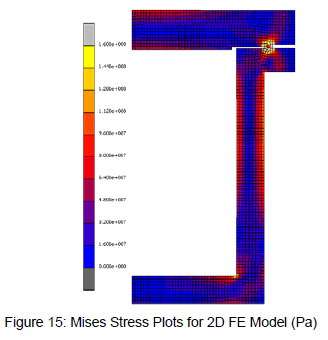
3.3.3 2D Model Results
Figure 15 shows the Von Mises stress for one of the four header box designs analysed in this study. This header box design, which is the same design used for the FE benchmarking test, was analysed using a linear solver in MSC.Marc. The model was constructed using roughly 2000 Q8 plain strain elements.
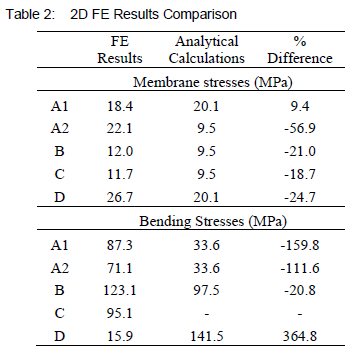
The numerical results of this model, calculated at the stress extraction points according to equations 1 and 2, are provided in table 2. The table also compares the FE results with those calculated using the current design method's analytical calculations referred to in section 2. In the % Difference column, a positive value indicates where the hand calculations are conservative and a negative value where they are non-conservative, when compared to the FE results.
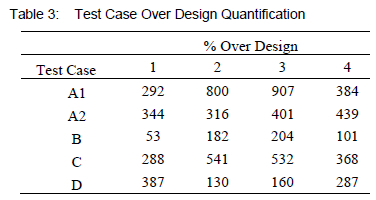
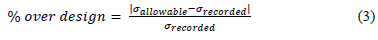
The percentage by which the structure exceeds the necessary design requirements at each of the stress extraction points on the structure is given in table 3. Table 3 also gives these results for an additional three test case designs which vary from the first design, having different internal pressures, bolt loads, wall thicknesses and overall height and widths. The percentages in this table were calculated as shown in equation 3, using the relevant stress values for the critical failure criteria. For points A1, A2 and C it was decide to limit the allowable stress for combined membrane and bending stress to 3S for a more conservative approach.
3.3.4 Discussion
When considering the results in this section, an important question arises: If the current design methods being used appear to be so non-conservative, why are their resulting header box designs so over conservative. To answer this question, one should consider how a designer uses the results predicted by these methods and what the influence of external factors are on the final design of a header box.
First, consider some of the external factors that influence the design of a header box, over and above the results from the design calculations. The plates used to construct header boxes are only available in set size intervals. Therefore, any calculated optimal design will automatically be rounded up to fit these values.
A second external factor is that a manufacturer will sometimes elect to increase the thickness of the material used to construct certain parts of a header box, in order to match the thickness of one or more of the other sides of the box. These decisions are usually motivated by logistical considerations, such as it being more economical or less complicated to order a larger quantity of a single thickness of plate than to order multiple metal plates having different thicknesses.
Another reason for this is that a manufacturer may already have stock of a certain plate, which is thicker than what is required, and choose to rather start construction earlier with this material in hand than to wait for a new order.
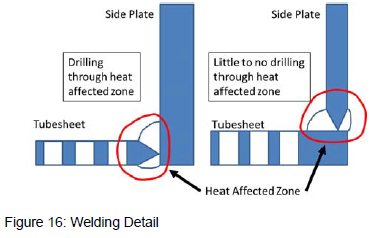
A final external factor, which is motivated by a manufacturing requirement, is that a header box's tube sheet thickness has to equal or exceed the thickness of the side plates. According to manufacturers, if the tube sheet is thicker than the side plate, the resulting joint must be welded from the side plate's side of the joint and vice versa, as illustrated in figure 16. If the joint is however welded from the tube sheet's side, the heat affected zone of the metal, where the material is then hardened, overlaps with where the tube sheet holes need to be drilled. Drilling these holes therefore becomes much more expensive as the cutters become blunt sooner and break more often.
In addition to these factors, there is also a human factor that comes into play, which tends to make header box designs more conservative. When using analytical calculation methodologies, designers tend to err on the side of caution and rather increase material sizes if they are at all uncertain, in a bid to ensure that their design will definitely be safe.
In the process of reviewing header box designs based on current analytical methodologies, this trend was encountered often. In many cases, an extra material thickness increment of 5 mm was found added onto the optimal design, as determined by the analytical calculations, even after all of the external influencing factors mentioned above had been taken into account. In the end, it is the compounded effect of all these factors that finally lead to a header box being significantly over designed.
4 Proposed Solution
The primary objective of this study was to implement methodology changes to the way header boxes are designed in order to increase the accuracy of the process. In order to achieve this goal it was decided to incorporate the results from a 2D FE analysis into the header box design pack, along with the analytical calculations from the current design method. This would serve to analyse the header box structure in more detail and validate the analytical calculations for each design case, thereby acting as a simultaneous numerical verification.
4.1 Software Structure and Components
In order to practically implement this plan, a new software package was developed that would automatically set up and analyse a 2D FE model of a cover type header box, based on a fixed set of parameters. Included in this package is also an optimiser that seeks to minimise the material used to construct the header box, while taking into account the material and manufacturing factors that influence a header box's design.
The principle reasons for choosing to develop new software rather than working with products available on the market were that:
1. New software can be coded on an open source platform, thus avoiding costly license fees
2. New software can be tailored to perform exactly the task needed without any unnecessary features that complicate its use.
4.1.1 User Interface
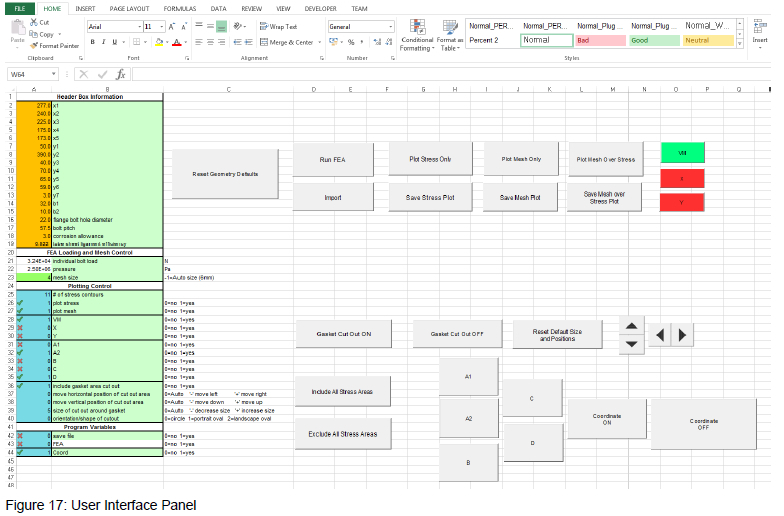
As part of the design process already in use by this study's industrial partner, all the information pertaining to a new header box's design is deposited into a Microsoft Excel document. Motivated by this, it was decided to base the user interface portion of the new software in this Excel document in order to integrate its functionality as seamlessly as possible into the design process already in use. An additional reason for choosing Excel rather than another platform for the user interface was that most people are already familiar with Excel. Thus most new users would immediately be able to operate the new software with a limited degree of training. A final benefit of using Excel is that it already features a large collection of built-in visual tools with which to create an easy to operate user environment. Figure 17 show the graphical user interface.
The user interface operates as a platform where the user enters a set of parameters describing the geometry and loading of a header box. From here the user can set certain preferences, such as mesh size and design factors, before performing an FE analysis on the header box. Once the analysis is complete, the results can be imported back to this interface, where they are then automatically processed to determine whether the header box meets the necessary failure criteria.
In addition to running a single analysis, the user can also choose to run an optimisation sequence that will run multiple analyses in order to determine the optimal design for the header box being considered.
Lastly, the interface allows the user to call for various results to be visually rendered in order to help the user understand the results.
4.1.2 FE Analysis
Once all the information about the header box is defined in the graphical user interface, the FE analysis software takes over and uses this information to automatically construct a 2D FE model of the header box and performs an analysis on its structure. The automated procedure followed by the program is as follows:
1. Mesh the header box structure according to the user's mesh size preference
2. Apply the relevant loads and boundary conditions
3. Set up a system of linear equations describing the structure
4. Solve for the stresses in the header box
4.1.3 Results Rendering
After the structure has been analysed, the rendering portion of the software allows the user to visualise the stress results in the form of a contour plot that shows the stress patterns in the header box cross section. The user can configure these result plots as required, giving him/her the option to decide whether to plot the stresses in the x-direction, y-direction or the von Mises stress. Furthermore the user can choose to annotate the plot to show the stress extractions points, coordinate frame reference or the mesh that was used in the analysis. A sample of the possible results output is shown in figure 17.
4.1.4 Optimisation
The objective function of the optimisation problem was to minimise the cross-sectional area of the tube sheet and the side plate, while satisfying all the constraints. The primary constraints were that the header box material was not allowed to exceed the relevant failure criteria.
Additional constraints were that the tube sheet thickness had to be equal to or exceed the thickness of the side plates and that only available material sizes could be used. Both the tube sheet and the side plate also had to be thicker than the minimum tube sheet and side plate thicknesses specified in API 6611. These constraints were added so that the optimiser would account as far as possible for all the external factors that influence the design of a header box, thus meaning that a predicted optimal design would be suitable for construction as is. The optimisation problem in standard form is given by:
Min f(x) = 0.5ax1 + bx2 + x1x2
Subject to:
x2 - x1 < 0
x1 > {minimum allowable tube sheet thickness}
x2 > {minimum allowable side plate thickness}
x1, x2 ε {available material thicknesses}
stresses meet all failure criteria set out in table 1
where:
a = internal width of the header box
b = internal depth of the header box
x1 = tube sheet thickness
x2 = side plate thickness
After experimenting with a genetic algorithm optimiser and looking at constrained gradient based optimisation, it was decided to rather use an optimiser that follows a simple search pattern in order to determine the optimum design. This optimiser follows a programmed search path, testing various predetermined combinations of available tube sheet and side plate thicknesses, until finding the optimum design.
The primary reason for this decision was that this technique would require the least amount of function evaluations before reaching the optimum design. This is because the problem at hand only has two design variables and it is only necessary to optimise to the nearest available metal plate thickness. Therefore the pool of possible answers is small enough for the search pattern optimiser to be more effective than the other methods considered.
5 Overall Results
5.1 Optimisation Potential
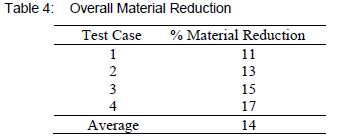
After having analysed the original designs of the four test cases, an optimisation was performed on each to see what their optimal side plate and tube sheet dimensions would be. The results showed an average weight savings potential of 42% on side plate materials and 27% on tube sheet material. When these results are put into the context of the header box as a whole, this translates to an average overall material reduction of 14%, as shown by table 4.
From these results, we can see that there is a significant savings potential available.
5.2 Research Impact
In its present form the new FE software is not yet developed to the point where it can be used as a primary design tool. However, it already allows a designer to remove some uncertainty from the current design environment.
In cases where a design has already been influenced by external design factors, such as material and manufacturing factors, the results from the FE software will give a designer the confidence to use the resulting design as is, without adding any further material out of caution. In cases where no external design factor have played a role, the designer can now rely on the accuracy of the FE analysis to either confirm the initial design or use it to adjust the design in any areas where the analytical calculations have not been able to capture the true structural behaviour of the header box.
The built in optimiser will also provide the designer with the least cost design, which will in turn double as the lower safety limit guideline for the header box's design. Additionally, the optimiser will give the designer the capability to modify the major dimensions of a header box and see how this impacts the final optimal design of the tube sheet and side plate, thus promoting better understanding of a header box's structural behaviour and allowing for an interactive design to take place between the various components of the header box.
6 Conclusion
The purpose of this study was to evaluate a method currently used to design cover type heat exchanger header boxes and improve the process to increase its accuracy.
The first step was to look at how the current design method works. In broad terms it was found that this method simplifies a header box to a collection of simply supported beams, each with a set of representative loads applied to it. Stresses in the header box are then calculated based on this model and compared to a set of failure criteria in order to ensure that the design is adequate.
In order to evaluate the accuracy of this method, an FE model of a header box was created in order for the results to be compared. First a full 3D FE model was created, but this was subsequently simplified to a representative 2D FE model in order to reduce computation effort and time.
The comparison of these two methods showed that the current design method predicts non-conservative stresses for many parts of a header box. At the same time, the FE results also showed that the header boxes which had been analysed for the comparison were all over-designed, even though they had been designed using the current design method.
These conflicting results were explained by considering several material, manufacturing and human factors that influence a header box's design, over and above the results from any standard design calculation, which all contribute to its over-design.
To advance the accuracy of present methodologies, a custom 2D FE software package was successfully developed, that would automatically set up and analyse a parameterised model of a cover type header box's structure. The software package was created to integrate directly with the Excel platform already being used to perform the calculations for the in-house code. An optimiser was also included in the software that takes material and manufacturing constraints into account, in addition to the material failure criteria.
The result is a tool that designers can now use to validate any existing designs as well as provide optimal designs and accurate stress predictions for new header boxes, thus reducing manufacturing costs and improving accuracy in the design process.
References
1. American Petroleum Institute, Air-Cooled Heat Exchangers for General Refinery Service Petrochemical and Natural Gas Industries, API STD 661, 2006.
2. Prinsloo L, A Critical Evaluation of the Design of Removable Cover-plate Header Boxes for Air-cooled Heat Exchangers, Masters Thesis, Department of Mechanical and Aeronautical Engineering, University of Pretoria, South Africa, 2011. [ Links ]
3. American Society of Mechanical Engineers, Rules for Construction of Pressure Vessels. In: ASME Boiler & Pressure Vessel Code, 6th edition. The American Society of Mechanical Engineers, New York, 2015.
4. Department of Labour, Republic of South Africa, Pressure Equipment Regulations, Government Gazette, 2012, No. 34995.
5. South African Board of Standards, Catergorization and Conformity Assessment Criteria for all Pressure Equipment, South African National Standard 347, 2012.
6. Zienkiewicz O and Taylor R, The Finite Method For Structural Mechanics, 6th edition, Elsevier, Oxford, 2005.
7. Zeng Z-J, Guo Y-Z and Gao J-J, A New Mechanical Model for Rectangular Structures Subjected to Internal Pressure, International Journal of Pressure Vessels and Piping, 1990, 42 (2), 237-246. [ Links ]
8. Guo Y-Z and Zeng Z-J, The Six-plate Analytical Method for Rectangular Pressure Vessels of Finite Length, International Journal of Pressure Vessels and Piping, 1997, 74 (1), 1-6. [ Links ]
