


Services on Demand
Journal

Article
 English (pdf)
 Article in xml format
 Article references
 Send this article by e-mail
Indicators
Related links
-
 Cited by Google
 -
 Similars in Google
Share

 Permalink
R&D Journal
On-line version ISSN 2309-8988Print version ISSN 0257-9669
R&D j. (Matieland, Online) vol.41 Stellenbosch, Cape Town 2025
https://doi.org/10.69694/2309-8988/2025/v41a1
Case Study: Evaluation of Stress Concentration Factors in Shaft Keyways Through FE Analysis
JP Jordaan
CSIR Mechanical Testing Laboratory, Meiring Naudé Road, Pretoria, South Africa. E-mail: jjordaan1@csir.co.za. ORCID 0009-0007-9400-7535
ABSTRACT
The finite element method (FEM) is utilised in evaluating stresses in keyways of shafts loaded in torsion. These stress values are divided by their corresponding nominal stresses to arrive at so-called stress concentration factors, which are compared against published charts and experimental results for specific reference cases. FEM has become ubiquitous in the analysis and design of mechanical systems. While simple and well-known formulas for analytical solutions are employed to calculate nominal stresses in static design, dynamic or fatigue design is typically concerned with higher-than-nominal stresses that are associated with localised geometric stress raisers present in the system. These higher stresses are derived from nominal stresses by multiplication with an appropriate stress concentration factor. At present, though, the application ofa multiplier to a nominal value seems somewhat redundant since the complete stress distribution - which includes the maximum stresses in areas of stress concentration - is a direct result from a finite element analysis (FEA). In this paper it is shown that FEA results not only compare favourably with available known results for commonly encountered stress raisers such as fillets and keyways but provide resolution to the stress distribution and paves the way for analysis and design of mechanical devices exhibiting uncommonly encountered stress raisers for which charts and formulas are not available.
Additional keywords: Torsion, Fillet, Keyway, Fatigue, Design, Strength
Roman
b Width of keyway [m]
d, D Diameter of shaft [m]
h Height of shoulder [m]
Kf Fatigue stress concentration factor [-]
Kt Theoretical stress concentration factor [-]
n Factor of safety [-]
r Radius of fillet [m]
Sy Yield strength [-]
Sf Fatigue limit []
t Depth of keyway [m]
T Torsional moment [N m]
Greek
α Angle of orientation relative to keyway-end [°]
φ Angle of reference in keyway fillet [°]
σ Stress (normal) []
τ Stress (shear) []
1 Introduction
A mechanical system is an assembly of mechanical parts that are (a) made from selected materials and (b) arranged into a desired geometry to (c) fulfil specific functions which frequently involves being loaded by forces, moments, pressures, etc. For convenience we shall simply refer to all such mechanical systems as machines (although structures may also be a preferred collective term). Mechanical design entails the processes and methods of selecting materials and part geometries (which include shaping and sizing) such that all user-, social-and regulatory requirements are being met by the machine. A concise and convenient breakdown of the design process is outlined in Ref. [1], which is well aligned with our definition of a machine above. The individual steps are:
• Geometric estimate (layout and sizing)
• Weight estimate (materials selection)
• Load estimate (functionality)
• Stress estimate (machine internal loads)
• Strength estimate (stresses are less than strength)
Several design requirements or considerations [2][3] are at play in mechanical design, many of which oppose each other, leading to trade-off situations and decisions. It should be no surprise that cost is a dominant design consideration that permeates all phases and facets of the design process. As such, the numerous and various technically feasible combinations of material and geometry almost always boil down to those of near-lowest cost, which frequently and perhaps typically implies that mechanical strength is reduced as low as possible (but not any lower than that!) subject to satisfying all constraints. In other words, adequate strength is obtained for a minimum amount of material and cost [1][4]. Even so, it would probably be fair to state that the single most important consideration that a mechanical engineer is constantly thinking about is mechanical integrity of the machine, which is understood as having adequate strength, stiffness, and stability [4]. For this reason, strength evaluation and stress analysis are conceivably the most important aspects of mechanical engineering design. The mechanical strength of a machine is derived from the combination of material- and geometric strength. Material strength is an inherent property that is independent of the shape or size of a material. Likewise, mechanical strength can also be seen as an inherent property of a part or machine that is independent of the loads being applied to it [2][3]. An isolated value for stress in its own does not add value without context, which is provided by the material specification. For example, a bending stress of 100 [MPa] may cause a wooden beam to break, while a structural steel beam should still perform quite satisfactorily. The relationship between stress and strength is the margin of safety, also expressed as the factor of safety [1][2][6] or, more recently, the design factor [3]. Let S designate the strength that corresponds with the stress when failure or loss-of-function of a part or machine occurs, and σ the stress of interest in the same part or machine during normal operation, then the factor of safety is defined as

It goes without saying that the operational stress should be less than the strength, implying that the factor of safety exceeds unity, i.e., n>1. In practice Eq. (1) is applied in rearranged form by specification of the factor of safety, e.g., n=3, from which the allowable stress, also called the design stress, is calculated as σ=S/n. The strength S is typically derived from the material properties such as the yield strength, in which case the symbol can be modified to Sy to emphasize this distinction. Although it may sound obvious to state, stress is not dependant on the material of construction but is only a function of the applied loading and the geometry of the machine. This follows intuitively from the definition of stress, which is force per unit area [4][5] with units [N/m2]. The calculated stress field can therefore be seen as the response of the structure geometry to external loads being applied to it.
1.1 Metal fatigue
The phenomenon of fatigue was discovered in the 1800s because of the many and frequent bridge and railroad failures that occurred in that period [7][8]. Investigators observed that components were cracking when subjected to repeated loading, even when the nominal stresses induced by the repeated loading were far lower than what was observed at immediate rupture of the same part [6]. Although machine- or structural failure is problematic in itself, fatigue failure is worse because final instability of the machine is sudden and brittle in nature, leading to catastrophic events. Whereas a ductile material exhibits ductile fracture at static strength, it now appears to exhibit brittle fracture at fatigue strength. The proliferation of metal machinery in the 1800s therefore called for the development of design procedures that would result in machines that do not fail from the application of repeated loading. Even so, it is estimated that fatigue contributes to around 90Prior to the Industrial Age, one can presume that structures were simply designed for strength, as opposed to the general distinction of design for static strength and design for fatigue strength that exists today. Due to the complexity of metal fatigue, it is viewed as a process comprising several distinct phases [7]:
• Nucleation
• Structurally dependent crack propagation (often called the "short crack" or "small crack" phase)
• Crack propagation that is characterizable by either linear elastic fracture mechanics, elastic-plastic fracture mechanics, or fully plastic fracture mechanics
• Final instability
The nucleation phase refers to the initial development of a crack which is eventually destined to propagate until final fracture of the machine occurs. To come back to the observation of cracking by the investigators, not only was the presence of cracks discovered, but it was also observed that virtually all cracks originated at points or regions of geometric irregularity. These geometric irregularities are sometimes caused by defects, but more often are simply the predictable result of standard and widely used mechanical design- and manufacturing processes. Mechanical design requires the machining of special features on parts such as transmission shafts to accommodate devices like bearings, pulleys, and gears. Bearings are seated against shoulders and retained by circlips, while gears interface with shafts via splines or keys, which require key-ways on both parts. An unfortunate consequence of a special feature, though, is that the stress distribution in the vicinity of the feature changes for the worst, irrespective of whether material is removed or added. For example, consider a smooth shaft that carries a bending or torsional load. If the diameter of the shaft is increased anywhere along the length of the shaft, this change in geometry causes the stress in that region to also increase beyond the average, even though there are now more structural material available to carry the same load as before. For this reason, these features are often called stress raisers, and the regions in which they occur are called areas of stress concentration [2].
1.2 Stress concentration factor
Traditional methods of stress analysis have been developed for simple geometries and standardised load cases, yielding simple and well-known analytical solutions. These basic methods are extensively covered in the mechanical engineering curriculum, and two such textbooks that contain very similar contents are referenced in [4] and [5], titled "Engineering Mechanics of Solids" and "Mechanics of Materials", respectively. Normal and shear stresses can readily be calculated for standard shapes of bars, shafts, beams and pressure vessels that are exposed to simple loadings such as point loads (tension and compression), bending, torsion, distributed loads and pressure. The notion of a stress concentration factor came about to account for the higher stresses that existed in areas of stress concentration in a consistent manner. Since the higher-than-nominal stresses are the direct result of stress raisers with known geometries, the factor is in fact defined as a theoretical stress concentration factor, designated Kt. The theoretical stress concentration factor is a unitless numerical value that is often greater than unity and is employed by multiplication with the nominal stress (which is derived from the basic analysis methods described above) to arrive at an elevated value for the stress. This elevated value is an estimate of the actual maximum stress in the region of interest.

The nominal stress is σηοη. Although stress raisers exist everywhere in machines, their presence is generally ignored when designing for static strength with ductile material. This is so because the volume of material associated with stress raisers is relatively small, hence only a tiny amount ofmaterial might yield upon load application and thereby relieve the high stress while the rest of the material carries the load. For this reason, stress concentration factors are generally associated with design for fatigue strength.
1.3 Design for fatigue strength
In Eq. (1) it is shown that the factor of safety, n, is the link between stress and strength in the design process. While the yield strength, Sy, of a material is a convenient reference in the design for static strength of parts, the concept of a fatigue limit (also called endurance limit) is associated with fatigue strength. The fatigue limit, designated Sf, is the limiting value of the median fatigue strength as the fatigue life becomes very large [9]. The allowable (design) stress can now be expressed in terms of the fatigue limit as σ = Sf/n. Design processes for fatigue strength are described in various textbooks [1][2][3] and standards [10], and are much more complex than the same for static strength. In all the above referenced procedures, the fatigue limit obtained from laboratory testing of prepared specimens is adjusted by several modifying factors which have the net effect of reducing the numerical value of the as-tested fatigue limit, S*f, as follows [3].

The various factors ka through kf are not defined in this paper, except to note that all are less than or equal to one. The older reference documents incorporate the effect of Kt by means of an additional modifying factor (also strength-reducing), but the most recent [3] correctly incorporates Kt as a stress-increasing factor instead.

The quantity q is called the fatigue notch sensitivity factor assuming any value 0 < q < 1, while Kf is called a fatigue stress concentration factor. Kf can be seen as a reduced (smaller numerical value) version of Kt due to reduced sensitivity to notches for the specific material of construction. Unfortunately, this definition mixes geometric information with material information, which the author considers unwise and confusing. Nevertheless, the important point is to illustrate how Kt is employed in the design process.
1.4 Keyways in power transmission shafts
In 1985 the ASME stated in one of its standards that: "It is now well accepted that most shaft failures are caused by progressive crack propagation resulting from fluctuating load, commonly called 'fatigue failure.' " [10]. It has furthermore been said that keys and keyways are one of the most common shaft-hub connections being employed in power transmission arrangements, such as gearboxes, for example [11]. Although keys and keyways are very convenient devices, they appear to be mechanical abominations. While the geometry of a basic shaft is very simple and easy to analyse for stress for a variety of load cases and their combinations, the addition of a standard keyway complicates the geometry in the region of interest beyond the scope of easy analysis. Experimental techniques were employed to generate empirical data which were and still are used in conjunction with elasticity theory, for example, to arrive at useful results. The theoretical stress concentration factor Kt is one such empirical quantity for which a multitude of stress concentration charts were produced over time. Standard charts are included in textbooks such as [2][3][4] and [5], but also in very useful compilations such as [6] and [12]. The book by Walter D. Pilkey, entitled "Peterson's stress concentration factors" [12] is perhaps the authority on the subject. Pilkey states in the opening paragraph of the preface that "Rudolph Earl Peterson (1901-1982) has been Mr. Stress Concentration for the past half century." The finite element method (FEM) is an extraordinary powerful numerical stress analysis technique that is rapidly becoming ubiquitous in the design of complex machines. Perhaps the most powerful feature of FEM is the ability to accurately approximate very complex geometry, including shoulders, key-ways and splines on shafts, for example. It is therefore quite possible that the concept of a stress concentration factor will fall in disuse as future generations of mechanical engineers exercise their trade. To help this process along, the ability of FEM to estimate the stress distribution in keyways is tested against the established methods for a few cases of interest. The first example is a prismatic shaft (circular cross-section) loaded in torsion only, which is both a simple geometry and a simple load case. The analytical- and numerical solutions are shown to be in excellent agreement. The geometry of the three-dimensional model is then somewhat complicated by introducing a step-up in diameter, incorporating a shoulder fillet of specified radius. The numerical stress solution of the complex geometry is then compared with the solution obtained by application of a stress concentration factor to the nominal stress solution. In the second and final example, a keyway is introduced into the prismatic shaft. A keyway is significantly more complex than a shoulder fillet, as there as various regions of interest with different stress concentration factors.
2 Stress Concentration in a Stepped Shaft with a Shoulder Fillet
2.1 Nominal information
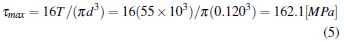
A straight, solid steel shaft of diameter d=120 [mm] is loaded in torsion only by a twisting moment T=55 [kNm]. The maximum shear stress resides on the outside surface of the shaft and is calculated as equal to [5]:
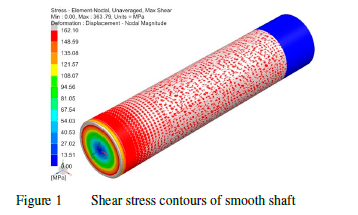
The same problem is solved in FEM. The shear stress contours of the FEA solution are displayed in Figure 1. The upper limit on the contour legend is deliberately and conveniently set to 162.1 [MPa] to correspond with the expected maximum shear stress as per Eq. (5). All values higher than this limit then overflows in silver, which aids with easy observation of the excellent agreement between analytical and numerical solution.
For pure shear, the von Mises equivalent stress is calculated:

The von Mises stress is employed below.
2.2 Stress concentration factor
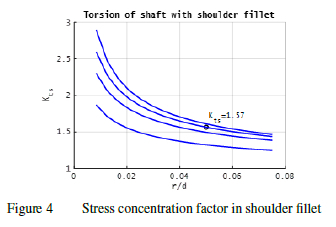
Several charts and formulae that quantify the stress concentration factors for various reference geometries have been developed and published over the years. The stress concentration factor for torsion of a stepped shaft with a shoulder fillet is reproduced from Roark's [6] and Peterson's [12], and displayed in Figure 2 and Figure 3, respectively. The salient information is summarised in Table 1.
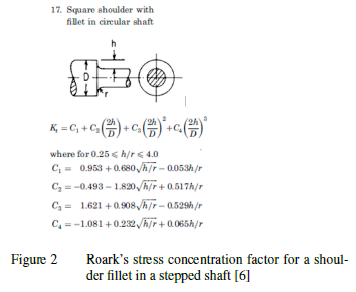
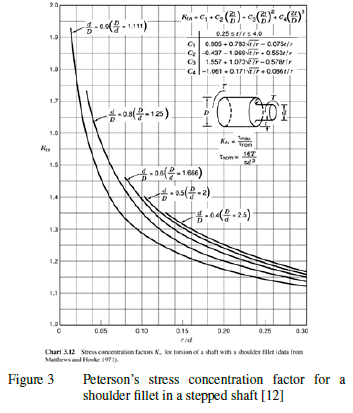
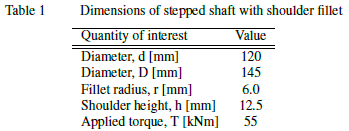
The ratio h/r = 12.5/6.0 = 2.1 falls between the limits of applicability 0.25h/r4.0, so that the stress concentration factor can be calculated at Kt = 1.52 according to Roark, and Kts = 1.57 according to Peterson. Note that Peterson attached and "s" to the subscript to emphasize "shear". The result of Peterson is also graphically displayed in Figure 4.
2.3 Finite element analysis solution
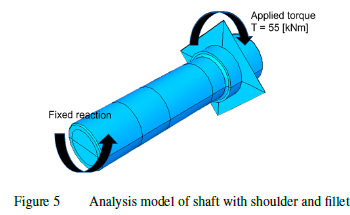
The new problem is subsequently solved by means of FEM. The analysis model is displayed in Figure 5 and the FEA stress solution is displayed in Figure 6.
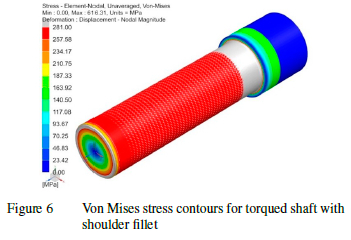
The finite element mesh consists of 219606 quadratic TET's. The von Mises stress contours, employing the equivalent upper limit of 281 [MPa] calculated in Eq. (6), are displayed in Figure 6. All regions that exhibit surfaces stresses more than this nominal value therefore overflows from red to silver to enhance visual interpretation.
Since it is not possible to evaluate the actual stress values in the vicinity of the shoulder from Figure 6, an alternative view of the same information is presented in Figure 7. Here the surface stress along the shaft length as the fillet is approached is displayed.
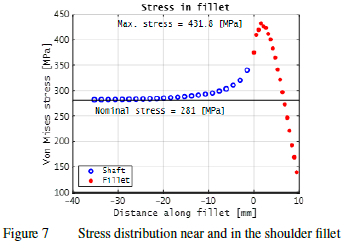
It is seen that the stress increases well beyond the nominal value as the shoulder (abscissa equals 0) is approached but reaches a maximum in the fillet near the toe. The results are summarised in Table 2.
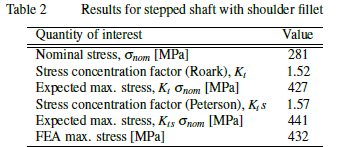
The FEA stress results are in excellent agreement with calculated results for both the nominal case, as well as the case where a stress raiser in the form of a shoulder is introduced.
3 Stress concentration in a keyway
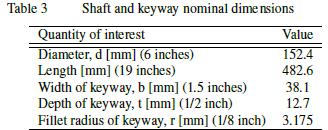
Experimental results reported by Fessler et al [13] (Fessler) on stresses in end-milled keyways in plain shafts that are subjected to combined loading are used as a reference to evaluate the accuracy of the FEA results presented. The authors (Fessler) used a frozen-stress photo-elastic method to determine surface stresses in keyway fillets (in both the prismatic section and the keyway ends). The nominal geometry, defined in Table 3, corresponds exactly with the specimens utilised by Fessler.
A CAD model of the shaft section defined in the table above is displayed in Figure 8.
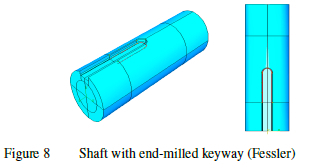
The section of the fillet for which stress results are reported is highlighted in red and corresponds with the same location in the fillet of Fessler's, viz. at a reference angle of 20° with the vertical (Fessler designates this angle of reference as the angle φ). In other words, as the fillet is entered from the flat section (the bottom) of the keyway, the angle of reference is φ=0° and increases up to a maximum of φ =90° as the fillet is exited, and the keyway wall is entered. Not only does the red line cover the whole keyway end but is extended beyond and well into the prismatic section of the keyway.
3.1 Stress concentration factor
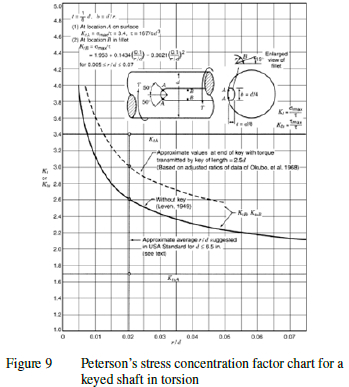
The stress concentration factor chart for torsion of a keyed shaft, where the keyways end in semi-circular arcs, is reproduced from [12] and displayed in Figure 9. Although it appears to present an inconsistency, it is important to note that the values for Kt in Figure 9 are defined such that the maximum principal stress is compared against the nominal shear stress. The same is true for the results reported by Fessler. This apparent anomaly is, however, not of major concern except to the extent that results from various sources are compared against each other. In actual machine design, the analyst works directly with FEA results instead of nominal results that are inflated with a stress concentration factor, which should minimise the room for error. It is important to note that Kt -values are not specified for the fillet in the keyway end, but only for the fillet in the prismatic section. Here, the angle of reference in the fillet is 0=15° as can be seen from the chart.
Fessler reported stress concentration factors for three regions of interest in/at the keyway, viz.
• In the fillet of the keyway-end
• In the fillet of the prismatic part of the keyway
• On the top of the keyway wall in the keyway-end
Fessler further defines the orientation along the length of the keyway fillet and the keyway wall by an angle α, which is measured relative to the longitudinal axis of the shaft as illustrated in Figure 10.
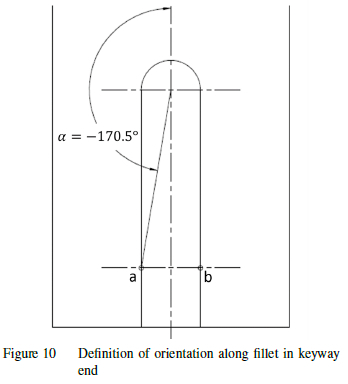
While Fessler only reported results for -90 <= α < 90 (the keyway-end) plus a single value for the fillet in the prismatic part of the keyway, we expand the scope somewhat beyond this range as per Figure 10, where the entry point to the keyway-end at (a) corresponds with an anglea = -170.5, and the exit point (b) corresponds with an angle α = 170.5.
3.2 FEA solution of stress in a keyway
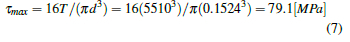
For an arbitrarily selected applied torque of 55 [kNm], which is the same value that we had before, the nominal (maximum) shear stress for a smooth shaft that corresponds with the keyed shaft defined in Table 3 is calculated:
The keyed shaft is subsequently solved by FEM. The maximum principal stress contours ofthe FEAresult are displayed in Figure 11. The contour scale upper limit is once again set at the nominal shear stress value of 79.1 [MPa] determined in Eq.(7).
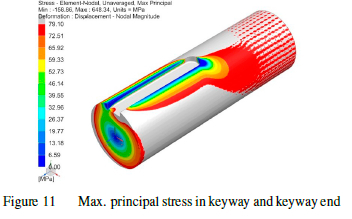
Large regions in and around the keyway experience stresses in excess of the nominal value, while the surface stress approaches the nominal value further along the shaft away from the keyway, as expected. The results are analysed below according to the regions of interest mentioned above.
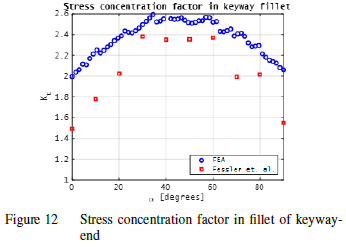
3.2.1 Keyway fillet
The maximum values of the stress in the keyway fillet are divided by the nominal stress to arrive at the stress concentration factor. These values are compared against the results of Fessler in Figure 12 for φ = 20. Fessler reported that a maximum stress concentration of 2.35 is found at α=50°, even though the actual data points have numerically higher values at α=30° and 60° of about 2.38 and 2.37, respectively. It is assumed that this conclusion was based on a fitted, smooth curve drawn through the actual data points by Fessler. Nevertheless, the FEA results show a similar trend, although higher values are solved for at all locations in the fillet, especially at the entry and exit to the keyway end, that is α=[0°; 90°]. At these points the FEA calculates a factor of about 2.0, while Fessler stated values of approximately 1.5.
In Figure 13 the region of interest is expanded to also include the other half (α=[-90°; 0°]) of the keyway-end, where the stresses are lower, and a definitive low point is reached at α=-50°. The stress distribution exhibits nearly anti-symmetric behaviour, depending on the direction of the applied torque. In other words, one expects the distribution to mirror across the axis a=0° should the applied torque be reversed.
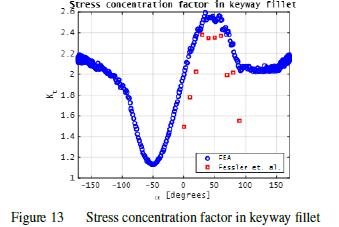
Figure 13 also illustrates the stress results in much of the prismatic section of the keyway as per Figure 10 definition. It is observed that the stress concentration in the prismatic section of the keyway appears to settle at a value of between 2.1 and 2.2 on both sides of the keyway as the distance from the keyway-end increases. In comparison, Fessler reported a single value of 2.25 in the fillet of the prismatic section of the keyway.
In addition, the reference value as per Figure 9 is calculated in comparison, although it is actually defined for φ=15°. The ratio of the fillet radius relative to the shaft diameter is r/d = 3.175/152.4 = 0.0208, which comfortably falls within the limits of applicability 0.005 < r/d < 0.07. The corresponding stress concentration factor is
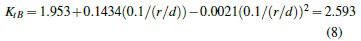
The subscript "B" identifies the points B in the keyway fillet in Figure 9. It is evident that the value of 2.59 exceeds both the FEA solution of approximately 2.2, as well as the value of 2.25 reported by Fessler, by a substantial margin. It is noted, though, that the results of Fessler and the FEA are for φ=20°, while those for Peterson's chart in Figure 9 is for φ=15°. Although the results are not presented here, it is further noted that the FEA solutions for φ=15° vs. φ =20° are quite similar in magnitude.
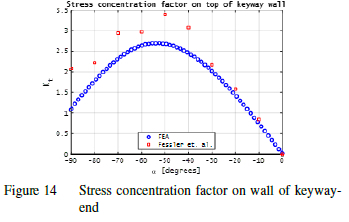
3.2.2 Keyway wall
The maximum values of the stress right at the top of the key-way wall are divided by the nominal stress to arrive at the stress concentration factor for this region. These values are, as above, compared against the appropriate results of Fessler in Figure 14.
The expanded view, α=[-170.5°;170.5°], is presented in Figure 15.
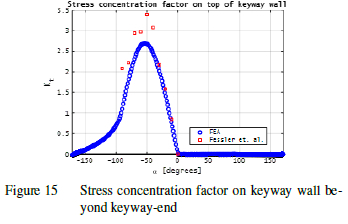
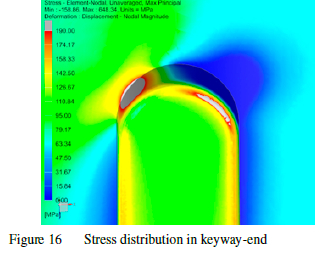
In this case all FEA values are numerically lower than those reported by Fessler, who reported a maximum stress concentration of 3.39 at α=50°. The chart of Peterson, Figure 9, lists only a single value for the stress concentration factor on the wall at α=50°, namely 3.4. Lastly, it is observed that the largest principal stress (tensile) on top of the wall occurs on the opposite side of the keyway (along the longitudinal axis) to that in the fillet. A contour plot of the stress distribution in the keyway illustrates this phenomenon clearly in Figure 16.
4 Conclusion
FEM is employed to evaluate the stress distribution in complex geometries, particularly those that give rise to areas of stress concentration, commonly referred to as geometric stress raisers. The ability of FEM to model and solve for the stress distributions in commonly encountered stress raisers, such as shoulder fillets and shaft keyways - for which experimental results are published, and formulae for stress concentration factors exist - is demonstrated. Stress concentrations are accounted for in the design process via the concept of a stress concentration factor, which is applied by multiplication with nominal stress values to arrive at elevated stress values. It is shown that direct solution of the complete stress distribution by means of FEA provides additional insight and stress resolution to the current methods. FEM paves the way for analysis and design of mechanical devices exhibiting uncommonly encountered stress raisers for which charts and formulas are not readily available.
4.1 Acknowledgement
The Department of Science and Innovation provided funding for this work under a Parliamentary Grant of the Republic of South Africa.
References
[1] Society of Automotive Engineers, Inc., Fatigue Design Handbook. 1968.
[2] Shigley JE, Mechanical Engineering Design, First Metric Edition, McGraw-Hill Book Company, International Edition, 1986.
[3] Budynas RG andNisbett JK, Shigley's Mechanical Engineering Design, Tenth Edition, McGraw-Hill Education, 2015.
[4] Popov EP, Engineering Mechanics of Solids, Prentice-Hall, Inc., 1990.
[5] Gere JM and Timoshenko SP, Mechanics of Materials, Third SI Edition, Chapman & Hall, 1991.
[6] Young WC and Budynas RG, Roark's Formulas for Stress and Strain, Seventh Edition, McGraw-Hill, 2002.
[7] ASM International, ASM Handbook, Volume 19, Fatigue and Fracture, 1997.
[8] Campbell FC (Editor), Elements of Metallurgy and Engineering Alloys, ASM International, 2008.
[9] ASTM International, ASTM E1823 - 13, Standard Terminology Relating to Fatigue and Fracture Testing, 2013.
[10] ASME, ANSI/ASME B106.1M - 1985, Design ofTrans-mission Shafting, 1985. (Withdrawn in 1994.).
[11] Pedersen NL, Stress concentrations in keyways and optimization of keyway design, Journal ofStrain Analysis for Engineering Design, 2010.
[12] Pilkey WD, Peterson's stress concentration factors, Second Edition, John Wiley & Sons, 1997.
[13] Fessler H, Rogers CC and Stanley P, Stresses at end-milled keyways in plain shafts subjected to tension, bending, and torsion, Journal ofStrain Analysis, 4(3), 180-189, 1969. [ Links ]
Received 12 January 2024
Revised form 15 April 2025
Accepted 15 April 2025
