



Services on Demand
Journal

Article
 English (pdf)
 Article in xml format
 Article references

 Automatic translation
 Send this article by e-mail
Indicators
Related links
-
 Cited by Google
-
 Similars in Google
Share

 Permalink

Town and Regional Planning
On-line version ISSN 2415-0495Print version ISSN 1012-280X
Town reg. plan. (Online) vol.86 Bloemfontein 2025
https://doi.org/10.38140/trp.v86i.8271
RESEARCH ARTICLE
Provincial inequalities in Iran: A comprehensive planning model for budget allocation
Provinsiale ongelykheid in Iran: 'N omvattende model vir die toewysing van begrotingshulpbronne
Ho se lekane ha liprofinse Iran: Moetso o felletseng oa kabo ea lichelete
Nima BayramzadehI; Mir Najaf MousaviII; Sanaullah PanezaiIII
IPh.D. student in Spatial Planning, Department of Geography, Urmia University, Urmia, Iran. ROR: https://ror.org/032fk0x53, Email: nima.bayramzadeh@yahoo.com, ORCID: https://orcid.org/0000-0003-2013-4922
IICorresponding author), Department of Geography, Urmia University, Urmia, Iran. ROR: https://ror.org/032fk0x53, Email: m.mousavi@urmia.ac.ir, ORCID: https://orcid.org/0000-0002-4814-5351
IIIDepartment of Geography and Regional Planning, University of Balochistan, Quetta, Pakistan. ROR: https://ror.org/04bf33n91, Email: sanaullah.panezai@gmail.com, ORCID: https://orcid.org/0000-0003-1460-1790
ABSTRACT
Although regional disparities were declining in Iran between 2001-2013, the provincial allocation of budgetary resources in Iran is not done fairly. The absence of a clear model for optimal budget distribution hinders achieving regional balance between Iran's provinces. Making use of applied research, this study identified 47 development indicators in 3 main development dimensions (economic-infrastructural, educational-cultural, and health-therapeutic) as the indictors to assess the characteristics of each province (level of development) to identify provincial inequalities of development in Iran. Descriptive analysis and the VIKOR model were used for the provincial development ranking in Iran during the years 2011 to 2021. Using comparative analysis, the K-means clustering method, the CV method, and GIS were used for calculating and mapping provincial inequalities. The results revealed severe inequalities among provinces. Tehran and Yazd provinces have had the highest development levels. CV calculations of the provincial indicators based on two scenarios (equal coefficients and AHP coefficients) showed that a budgetary resource distribution model that provides the percentage of budget allocation, by taking into account the territorial divisions, features, and sustainable development indicators of each province, might reduce inter-provincial inequalities, and would help achieve sustainable and equitable development at the provincial level. This model uses a method that optimally allocates financial and budgetary resources based on the degree of development of the regions and environmental characteristics.
Keywords: Provincial inequalities, regional inequalities, SDG-10, reduced inequalities, budget allocation model, Iran
OPSOMMING
Alhoewel streeksverskille in Iran tussen 2001 en 2013 afgeneem het, bly die provin-siale toewysing van begrotingshulpbronne onbillik. Die gebrek aan 'n duidelike model vir optimale begrotingsverspreiding belemmer streeksbalans. Hierdie studie gebruik toegepaste navorsing om 47 ontwikkelingsaanwysers oor drie hoofdimensies -ekonomies-infrastruktuur, opvoedkundig-kultureel en gesondheids-terapeuties - te identiflseer om die ontwikkelings-vlak van elke provinsie te bepaal en ongelykhede te ontbloot. Deur beskry-wende statistiek en die VIKOR-model is provinsies tussen 2011 en 2021 gerang-skik volgens 'n provinsiale ontwikkeling-sranglys. Verdere analise, insluitend die K-gemiddelde-groepering, CV-metode en GIS, is gebruik om ongelykhede te bereken en visueel voor te stel. Resultate toon ernstige ongelykhede, met Teheran en Yazd as die mees ontwikkelde provinsies. Twee scenario's vir gewigte - gelyke en AHP-koëffisiënte - toon dat 'n herverdelingsmodel wat die unieke kenmerke en ontwikkelingsaan-wysers van elke provinsie in ag neem, ongelykhede kan verminder. Die voorgestelde model stel 'n billike, volhou-bare benadering tot hulpbronverdeling voor deur begrotingsfondse toe te ken op grond van streekontwikkelingsvlakke en omgewingsfaktore. Hierdie benadering bevorder regverdige provinsiale ontwikkeling en ondersteun strategiese beplanning vir streeksbalans.
KAKARETSO
Leha likarohano tsa libaka li ile tsa fokotseha Iran pakeng tsa 2001 le 2013, kabo ea lisebelisoa tsa lichelete har'a liprofinse ha e etsoe ka toka. Ho haella ha mohlala o hlakileng oa kabo e nepahetseng ea tekanyetso ho sitisa ho fihlella tekano lipakeng tsa liproflnse. Thuto ena e sebelitse lipatlisiso tse sebetsang ho khetholla matsoao a 47 a nts'etsopele ka har'a likarolo tse tharo tsa mantlha: moruo-le-infrastraktjha, thuto-le-setso, le bophelo bo botle. Matsoao ana a sebelisitsoe ho lekola boemo ba nts'etsopele ea profinse ka 'ngoe le ho supa ho se lekane ha nts'etsopele Iran. Ho ile ha sebelisoa tlhahlobo e hlalosang hammoho le mohlala oa VIKOR bakeng sa ho beha liproflnse maemong a nts'etsopele bak-eng sa lilemo tsa 2011 ho isa ho 2021. Tlhahlobo ea papiso e sebelisitse mek-hoa ea K-means, CV, le GIS ho lekanya le ho bontša ka limmapa ho se lekane ha liprofinse. Liphetho li bontšitse phapang e kholo, moo Tehran le Yazd li leng mae-mong a holimo. Mekhoa e fapaneng ea li-coefficient (e lekanang le ea AHP) e bontsitse hore mohlala oa kabo ea lise-belisoa o ka fokotsa ho se lekane haeba o ela hloko litsobotsi tsa sebaka, likarolo tsa tikoloho, le matsoao a nts'etsopele. Sena se ka thusa nts'etsopele e tsitsit-seng le e lekanang.
1. INTRODUCTION
The uneven social, economic, and environmental development and regional inequalities are widely recognised as key problems in the 21st century and have been addressed by the 2030 United Nations Sustainable Development Goals (Jiang & Shi, 2023), because of the negative impacts on social cohesion, sustainable development, and political unity (Wei et al., 2020). Inequity prevents governments from enhancing the well-being of their entire populace. Nations cannot achieve progress and development if they fail to include all individuals. Thus, addressing social and economic inequality becomes crucial (Taylor et al., 2022). Balance in regional development is, therefore, essential for achieving sustainable development in a country (Pourfaraj et al., 2019).
Several studies have assessed regional inequalities across the globe. Zhang et al. (2024) mention that, in the Guangdong-Hong Kong-Macau Greater Bay area, city-regional administration viably decreases territorial imbalance and brings around territorial merging, but its adequacy shifts over diverse topical ranges of participation. Çinar (2023) mentions that Turkey demonstrates a negative relationship between the territorial advancement trap1 and financial complexity, recommending that areas with more complex beneficial structures may be less likely to drop into the trap. Capuno's (2022) study examined regional poverty and inequality in the Philippines during the years 2000 and 2018. The results of this research show that the experience of the Philippines in the years 2000-2018 emphasises that growth alone does not guarantee poverty reduction, while growth with balanced distribution can be productive.
Several studies have assessed regional inequalities in Iran. Mosayyebzadeh, Mozafari Niya & Shabestar's (2022) study investigated and analysed spatial inequalities and measured regional development status in Iran's provinces. Their research shows that Iran's spatial organisation has become multilevel and the provinces that act as poles of development were cut off from their downstream regions in terms of development indicators, or centralisation in the field of capital attraction, population, and industry have caused spatial imbalances within and outside the region. Karimi Moughari and Barati (2017) used a set of 25 indicators on 5 dimensions: economic, infrastructure, knowledge and human capital, as well as social-cultural and environmental dimensions for assessing the levels of regional inequality among Iranian provinces. The results show that regional disparities have declined between 2001 and 2013. During this period, Tehran, Yazd, and Semnan provinces had the highest development level, whereas Sistan-Baluchistan province had the lowest level. Moreover, Rahimibadr's (2013) study analysed the pattern of income distribution in Iran's urban and rural areas. The results indicate that income distribution in urban and rural areas is improving.
Reduction in inequality is much more complex and requires deeper changes in the economic system (Salehi-Isfahani, 2017). In many instances, certain areas within a country exhibit a higher level of prosperity in comparison to other regions, characterised by a larger proportion of attractive job opportunities and access to quality services. These areas, typically situated in remote locales, exhibit slower progress (Castree, Kitchin & Rogers, 2013). In various research, strategies have been pointed out, in order to reduce regional inequality. Da Silva (2021) mentions that regional inequality is caused by a mix of different things that are connected to each other and vary in different places. Each country has its own reasons for why things happen, but they are also connected to bigger worldwide processes. A spatial, multidimensional, and multiscale approach will thus be necessary to overcome regional inequalities. Cörvers and Mayhew (2021) point out that most of the academic research shows that globalisation and changes in the types of businesses in the economy have created inequality. Moreover, Capello and Cerisola (2023) mention that short-term normative interventions should go in the direction of supporting modern and technologically advanced traditional sectors rather than necessarily pushing Central and Eastern European countries towards a high value-added industry specialisation.
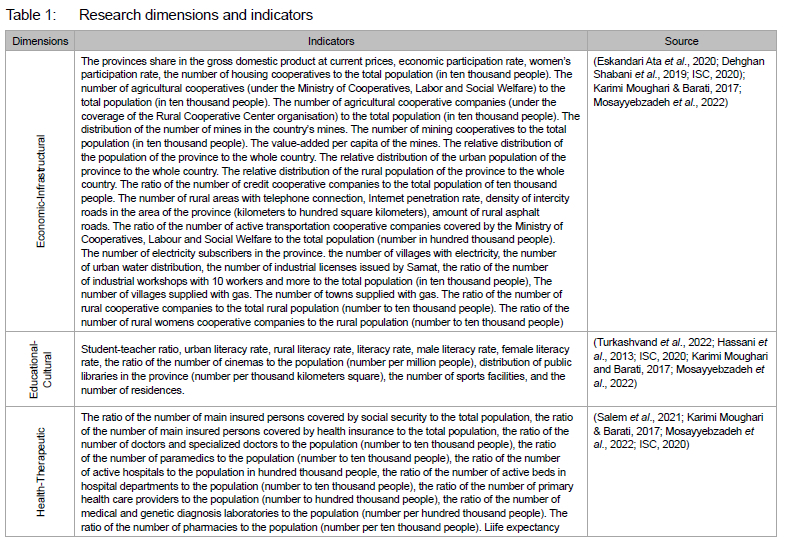
Several empirical studies also verified that regional and provincial inequalities exist in Iran (Abbasi Taghi Dizej & Pashazadeh, 2021; Ahmadi, Falahati & Delangizan, 2020; Pourfaraj et al., 2019; Rahmani Fazli, Falahati & Delangizan, 2019; Ibrahimzadeh, Mousavi & Kazemizad, 2012; Amirahmadi, 1986). The phenomenon of regional inequality is driven by the rapid and unbalanced growth in Iran (Sabbaghi, 2020), and has large disparities among provinces that continue to grow (Noorbakhsh, 2003). Regional inequalities in Iran may be attributed to the ethnic and cultural differences, the limitations of regional markets, and the market-oriented nature of Iranian industries (Afrakhteh, 2006). The creation and expansion of regional inequality in Ira can also be attributed to factors such as the availability of natural resources, ethno-cultural issues, unclear planning system, the existence of growth poles, and economic dualism (Pourfaraj et al., 2019). Despite the efforts of the government to support underdeveloped areas, regional inequalities remain a reality (Afrakhteh, 2006). The 1979 revolution in Iran prioritised the goals of poverty reduction and income equality. While there has been notable success in decreasing poverty rates, there has been limited advancement in eliminating income inequalities, due to the low priority given to this issue by policymakers (Salehi-Isfahani, 2017). In this regard, in the first decade after the revolution in the 1980s, special attention was paid to reducing the deficiencies between developed and underdeveloped regions, controlling urban sprawl, regularising urban and rural development, as well as creating a balance in the distribution of services (Afrakhteh, 2006). As a result, Karimi Moughari and Barati (2017) reported that, although regional disparities were declining in Iran between 2001-2013, no attention has been paid to the direction of the optimal distribution of the budget between the provinces and the regions in Iran. The absence of a clear model for budget distribution hinders achieving regional balance between Iran's provinces, a prerequisite for sustainable development (Pourfaraj et al., 2019). To create regional equilibrium and address disparities, a fair distribution of the budget in the provinces of Iran is needed. Therefore, to provide a model for the fair and optimal provincial allocation of budgetary resources in Iran, it was important to assess the characteristics of each province (level of development), in order to identify provincial inequalities of development. The level of development of the country's provinces in 2011-2021 were measured for 47 development indicators in the three main economic-infrastructural, educational-cultural, and health-therapeutic development dimensions (Table 1).
The main goal of this proposed resource distribution model is to provide the optimal budget framework and a method that optimally allocates financial and budgetary resources based on the degree of development of the regions and their environmental characteristics to fairly distribute the budget in the provinces in Iran.
2. LITERATURE REVIEW
2.1 Growth pole
The phrase 'growth pole' was introduced into economic literature in 1949 by Francois Perroux (Darwent, 1969: 5). By inventing a new concept termed the 'growth pole', Perroux made a fundamental change in the issues of regional development and spatial planning. He believed that development does not happen everywhere simultaneously, but at first with different intensity in the poles of development and then in different regions. Finally, it affects the entire economy (Teymoori, 2019: 84). Thus, in the flrst stage, it causes divergence and, in the second stage, it causes convergence and the disappearance of inequality. In this regard, for some reason, the heterogeneous growth and development of countries lead to the creation of inhomogeneous development in the form of core-periphery, which was presented by John Friedman as the key term of the dependency theory for the development and non-development of countries in the 1960s and 1970s (Fotros & Fatemi Zardan, 2020: 67).
In the growth-pole theory, Perroux (1955) and Hirschman (1958) stated the relationship between inequality and development stages in such a way that, in the early stages of development, rapid growth takes place in the growth poles and causes divergence and increasing inequalities between regions. Then, in the next stages of development and after the growth poles have become sufficiently concentrated and strong, their growth will gradually spread to other regions and ultimately lead to convergence and elimination of inequalities (Dehghan Shabani, Hadian & Negahdari, 2019: 879).
2.2 Regional inequality
Traditional economic approaches based on the neoclassical growth theory have mostly posited that policy intervention targets less prosperous regions (Iammarino, Rodriguez-Pose & Storper, 2019: 10). In this regard, theories of regional inequality have been heavily influenced by neoclassical economics and the notion of long-term convergence, although economics has become more plural over time. Neoclassical economics and growth pole models maintain that factor mobility and diffusion tend to equalise regional differentials in the long run (Wei, 2015: 2). The neoclassical growth model predicts that the growth rates of various countries will ultimately converge (Diaz-Bautista & Andrade, 2014: 188).
In 1965, Jeffrey Williamson formulated his famous hypothesis about long-term regional inequality. He considered a large set of regional per capita income data between 1920 and 1960 and found the peak of inequality in the middle of this period of economic growth (Enflo, Alvarez-Palau & Marti-Henneberg, 2018: 51). Regional inequality pertains to disparities in the quality of life, wealth, and living standards among individuals residing or employed in various locations. The focus lies on disparities in human welfare or well-being, as well as on interconnected facets of regional existence (Dunford, 2009). Every country experiences notable disparities in income and wealth across different regions, although the magnitude of these disparities differs from country to country. Furthermore, regional inequalities in income and wealth also change over time (Cörvers & Mayhew, 2021).
The consistent distribution pattern of planned investments across various regions within a country is referred to as regional balance. It aims to distribute investments in a way that equalises the growth rates of the nation's various regions, which eliminates any regional disparities. Therefore, the rate of growth in underdeveloped regions should be higher than the rate of growth in developed regions to achieve regional balance (Capello, 2015).
Some believe that the natural characteristics of the regions as well as the economies of scale are factors that increase regional inequality, whereas others emphasise the decreasing trend of inequality over time. Therefore, some believe in the non-interference of the government and the reduction of inequality over time, and others believe in the intervention of the government. They are of the opinion that it is necessary to reduce regional inequalities (Zebardast & Haghroosta, 2017: 154). In general, the lack of proper utilisation of the existing capacities in the provinces of the country, on the one hand, and the unfair distribution of facilities, on the other, have caused income disparties between the country's provinces (Amanpour & Mohammadi, 2021: 106).
2.3 Development indicators
The Statistical Center of Iran publishes a report every four years titled "The economic, social, and cultural standing of provinces", which outlines the level of development of Iran's provinces based on various development indicators (SCI, n.d.). Despite the country's commitment to reducing development gaps between different regions, the existing planning documents lack a clear and effective model to achieve this goal (Mousavi et al., 2024: 1).
Various articles were used to identify the dimensions and indicators of development (Eskandari Ata et al., 2020; Dehghan Shabani et al., 2019; Karimi Moughari & Barati, 2017; Mosayyebzadeh et al., 2022; Turkashvand et al., 2022; Hassani et al., 2013; Salem, Jahangard & Jabari 2021; Mousavi & Bayramzadeh, 2024; Bayramzadeh & Mousavi, 2024; Mousavi et al., 2024). Based on the reviews conducted by the authors in these articles, the indicators of development included three dimensions, namely economic-infrastructural, educational-cultural, and health-therapeutic. These dimensions can serve as effective criteria for assessing the level of development, as they encompass all aspects thereof.
To assess the state of development, 47 indicators have been used in the three main economic-infrastructural, educational-cultural, and health-therapeutic dimensions (Table 1). These data have been extracted mainly from the statistical yearbook of the Iranian Statistical Center for the years 2011 to 2021.
3. CASE STUDY AREA
This study encompasses all 31 provinces of Iran, namely East Azarbaijan, West Azarbaijan, Ardabil, Isfahan, Alborz, Ilam, Bushehr, Tehran, Chaharmahal and Bakhtiari, South Khorasan, Razavi Khorasan, North Khorasan, Khuzestan, Zanjan, Semnan, Sistan and Baluchestan, Fars, Qazvin, Qom, Kurdistan, Kerman, Kermanshah, Kohgiluyeh and Boyer-Ahmad, Golestan, Gilan, Lorestan, Mazandaran, Markazi, Hormozgan, Hamadan, and Yazd (see Figure 1). According to the Statistical Yearbook of Iran (ISC, 2021), the country covers an area of approximately 1.6 million square kilometers and has a population of roughly 84 million. Geographically, Iran lies between 25° and 40° north latitude and 44° to 63° east longitude, sharing 8,640 kilometers of land borders with neighbouring countries.
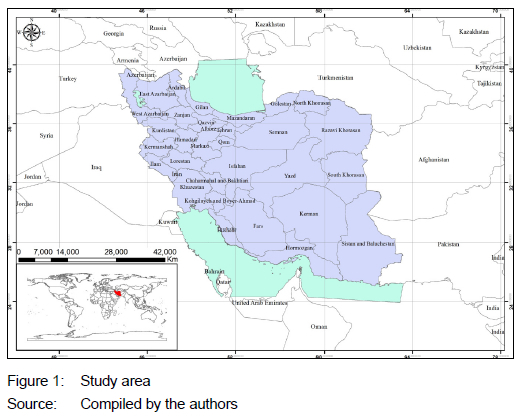
As a developing nation, Iran continues to grapple with significant regional disparities, despite ongoing efforts by policymakers to address these imbalances. These inequalities are particularly evident in the uneven distribution of public services and per capita resources. Tehran Province, for instance, not only holds the largest share of the population, but it also functions as a dominant hub for economic growth and development, further exacerbating regional inequalities across the country.
4. METHODOLOGY
4.1 Research design
Applied research was used to propose a model for the fair and optimal provincial allocation of budgetary resources in Iran. Applied research allows for the use of numerical data (quantitative), descriptive analysis, and comparative analysis of the data (Hekmatniya & Mousavi, 2006). In this study, the K-means clustering and Q-level (compromise) of each province were evaluated to cluster and rank the level of development in the provinces in Iran based on statistical data (quantitative) retrieved from the statistical yearbooks of the ISC from 2011 to 2021. The Q-level results were used to elaborate on the three main dimensions of development indicators (economic, social, and infrastructure), to also include territorial features (population and area), and territorial divisions (number of townships, cities, and villages). In the comparative analysis, the coefficient of variation
(CV) results were used to measure the inequality of development in Iran, in order to compare and understand financial and resource (Acquisition Budget) distribution in Iran's provinces. The Q-level and CV results were used to propose the Budget Allocation model with three effective dimensions based solely on the capabilities and potential of the provinces' territories, in order to reduce regional inequalities of the distribution of resources (Acquisition Budget).
4.2 Data collection
Data for this research were collected through library-based methods, drawing primarily from the Statistical Yearbooks published by the Iranian Statistics Center (ISC) for the years 2011 to 2021. The dataset encompasses Iran's 31 provinces and is based on the indicators outlined in Table 1 (ISC, 2020). As the ISC is the official governmental authority responsible for national data collection and reporting, the use of its publications ensures the validity and reliability of the data.
Furthermore, these statistics are publicly accessible in Persian through the official website of the Statistics Center of Iran, with annual data available for each year under study.
4.3 Data analysis and interpretation
This study presents an optimal budget allocation model aimed at reducing provincial inequalities in Iran. To assess and rank the level of development across the country's 31 provinces from 2011 to 2021, the VIKOR method - a multi-criteria decision-making (MCDM) approach - was employed.
Developed by Opricovic and Tzeng, VIKOR is a compromiseranking method designed to identify solutions that represent a balance between conflicting criteria (Opricovic & Tzeng, 2004; 2007).
To determine the weights of the development indicators (as listed in Table 1), Shannon's entropy method was applied (Shannon, 1948). Statistical data for each indicator were collected separatelyfor all provinces and subsequently weighted, using the entropy model.
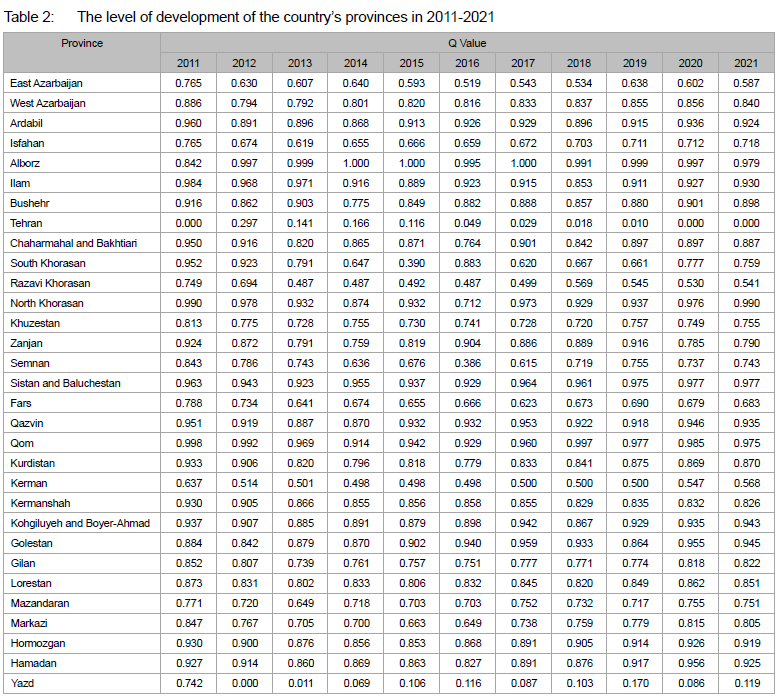
An initial decision matrix was constructed from these weighted values. Following normalisation of the matrix, the S (representing the best alternative) and R (representing the least desirable, but not worst alternative) values were calculated using Equations 1 and 2. Finally, the Q value, representing the overall compromise solution, was computed for each province according to Equation 3. The resulting rankings are presented in Table 2.
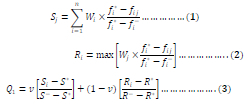
According to Equation 3, S*= min Si; S¯= max Si; R*= min Ri; R¯= max Ri.
In the VIKOR model, the Q-level represents a measure of compromise between the ideal solution and the alternatives being evaluated. This allows for a systematic comparison and prioritisation of options based on their performance against the defined criteria (Chatterjeea & Chakraborty, 2016). After evaluating the Q-level, the provinces were ranked based on the Q-level (Table 2) so that the low
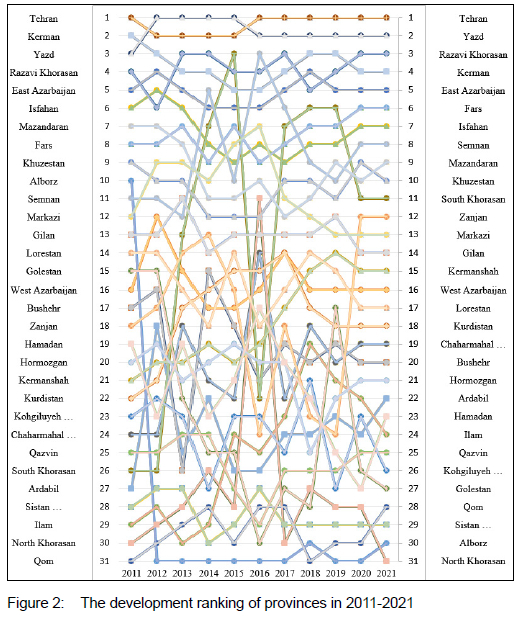
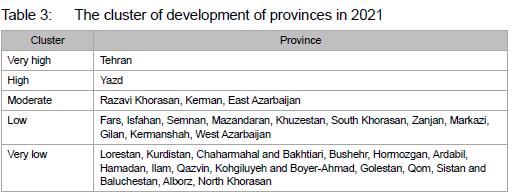
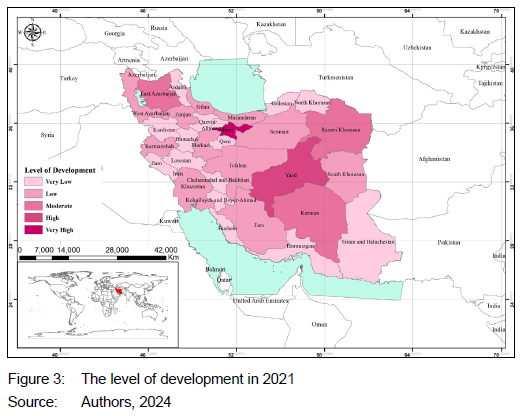
Q value obtained the first rank and the high Q value obtained the last rank for the level of development of each province (Figure 2). In addition, using the K-means clustering method (Li & Wu, 2012) in SPSS (Table 3), the provinces are clustered into 5 levels of development, namely very low, low, moderate, high, and very high. Then, the map (Figure 3) of the development level in 2021 was drawn, using GIS.
Many statistical methods, including the coefficient of variation (CV), have been widely used to measure regional inequalities (Liu et al., 2024).
Therefore, in this research, CV was used to measure the inequality of development in Iran. According to Equation 4, xi is the observations of the ith province, x̅ represents the average variable, and n is the number of provinces in the study area.
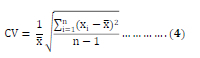
According to Equation 4, a high value of CV indicates greater inequality in the distribution of indicators among provinces.
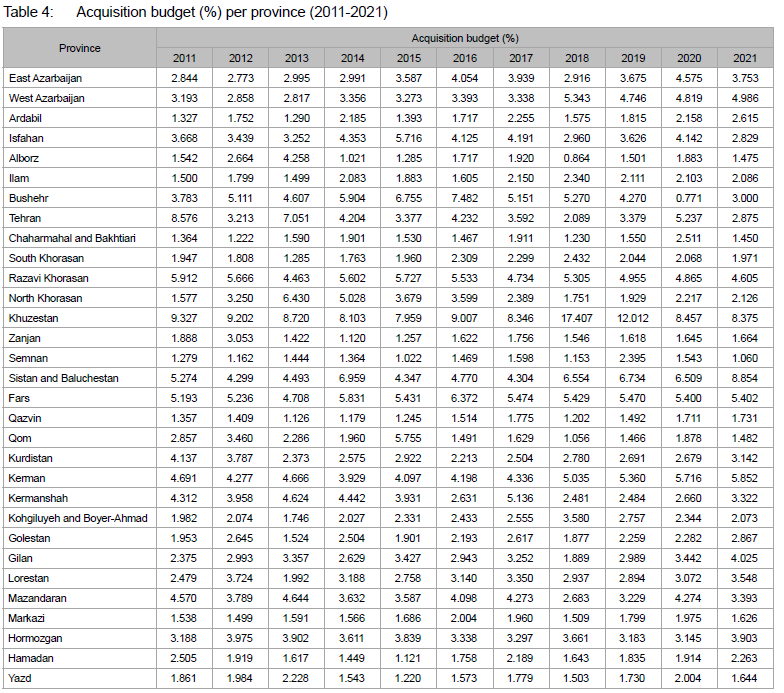
To evaluate the distribution of the Acquisition Budget among the provinces, statistics provided by the Statistical Center of Iran were used (SCI, n.d.). Due to the large numbers involved, this information was converted into percentages of the Acquisition Budget. Based on the distribution, the percentage share of each province was assessed by Equation 5 and using Excel, as shown in Table 4.

According to Equation 5, Bi is cquisition Budget of provinces i.
5. Results
5.1 Level of development of the country's provinces in 2011-2021
The level of development of the country's provinces was examined, using the VIKOR model. Table 2 shows the results of this evaluation separately for each province in the years 2011 to 2021.
As shown in Table 2, the development status of each province from 2011 to 2021 was evaluated based on the selected indicators. The findings indicate that, in 2011, Tehran Province recorded the lowest Q value (Q = 0.00), reflecting the highest level of development among all provinces. However, this value increased between 2012 and 2015, during which the relative positions of Tehran and Yazd provinces shifted. This suggests that development policies implemented in Yazd during that period contributed to measurable improvements in its development status. In contrast, since 2012, Alborz Province has consistently recorded the highest Q values (Q > 0.900), indicating the lowest level of development among the provinces studied.
To more effectively illustrate the evolution of provincial rankings over time, Figure 2 graphically represents the rankings from 2011 to 2021.
As illustrated in Figure 2, the provinces of Tehran, Yazd, Kerman, and Razavi Khorasan consistently ranked among the top four in terms of development throughout the study period. Tehran Province, in particular, functions as a major development hub, owing to its concentration of economic, social, and infrastructural resources, as well as its political and administrative centrality. This accumulation of assets has reinforced Tehran's position as a development pole, contributing to persistent regional disparities, despite some signs of improvement since 2012. Meanwhile, the provinces of Yazd, Razavi Khorasan, and Kerman have also shown steady progress, which may be attributed to the implementation of targeted development strategies during the period under review.
5.2 The cluster of development of provinces in 2021
The K-means clustering method was used to cluster the level of development of the provinces in 2021, and the results of this evaluation are shown in Table 3 and Figure 3.
Table 3 presents the development levels of Iran's provinces, highlighting a marked concentration of development in Tehran and Yazd. The clustering analysis categorises the provinces into five groups. Tehran stands alone at a very high level of development, followed by Yazd at a high level. Kerman, Razavi Khorasan, and East AAzarbaijan fall into the moderate development category, while the remaining 26 provinces are classified as having low or very low levels of development. Notably, these five more developed provinces account for approximately 35% of the national population and 26% of the country's total land area.
Figure 3 further illustrates that Iran exhibits a core-periphery spatial development pattern. The dominance of a centralised planning system, rooted in growth pole theory and neoclassical economic principles, has reinforced regional disparities, resulting in greater development in central provinces compared to those along the borders. Among the border provinces, Razavi Khorasan has achieved higher development levels, due to its religious significance and political status, whereas East Azarbaijan has benefited from its historical legacy, commercial activity, and tourism potential.
5.3 Regional inequalities of development based on CV
After examining the level of development of the provinces, the regional inequalities among the provinces in Iran during the years 2011 to 2021 were investigated by CV and for Q value, and the results of this assessment are shown in Figure 4.
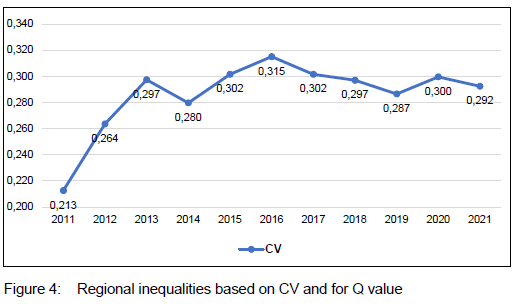
According to Figure 4, to obtain the CV, the Q value from Table 2 and Equation 4 is used. Based on Q value of provinces, the CV value increased from 0.213 in 2011 to 0.292 in 2021, indicating greater inequality in the distribution of indicators over time. During the 10 years under review, regional inequality has not only decreased, but there has also been a sharp divergence between the provinces of the country, due to political considerations and geopolitical conditions of the border provinces.
Considering the findings presented in Table 2 and Figure 4, it is worth emphasising that, due to its political and administrative centrality, economies of scale, capital accumulation, and high returns on investment, Tehran Province has experienced substantial development, leading to a pronounced divergence between Tehran and other provinces.
5.4 Acquisition budget (%) per province (2011-2021)
One of the key drivers of regional inequality in Iran is the suboptimal allocation of budgetary resources, which often fails to reflect the actual territorial potentials and capabilities of each region. Instead, the distribution of public funds and credits has largely been shaped by political economy dynamics and the relative political influence of different regions. As a result, provinces with greater political leverage have attracted disproportionate shares of resources and investment, leading to accelerated development in those areas and widening regional disparities. To address this imbalance, it is essential to prioritise economic and territorial factors over political considerations in the allocation of public funds. Greater emphasis should be placed on aligning resource distribution with the developmental needs and latent capacities of less-developed regions. In this context, Table 4 illustrates the current method of allocating credits for the acquisition of capital assets.
The findings in Table 4 indicate that the government has directed a greater share of the acquisition budget toward less developed regions in an effort to reduce regional inequalities. While more developed provinces continue to receive a larger portion of current expenditures, due to their established economic infrastructure and labour force, the data for 2021 show that two less developed provinces, Sistan and Baluchistan and Khuzestan, received 8.854% and 8.375% of the acquisition budget, respectively. Together, these provinces accounted for over 17.2% of the total acquisition budget, despite representing only about 10% of the national population (ISC, 2021). This suggests that the acquisition budget has the potential to serve as a key instrument for promoting regional balance, provided its allocation is guided by territorial needs and development potential, rather than by political influence. In line with this, the present study proposes a model for the optimal allocation of the acquisition budget, based exclusively on regional capabilities and potential, and independent of the political power dynamics that have historically shaped budgetary decisions. This approach aims to support a more equitable and balanced territorial development strategy
5.5 Proposed model for optimal budget allocation
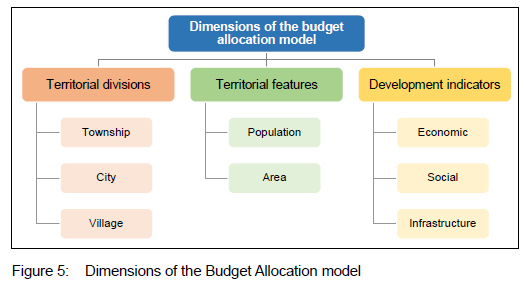
To optimally distribute resources (acquisition budget), a proposed model based on development indicators (economic, social, and infrastructure), territorial features
(population and area), and territorial divisions (number of townships, cities, and villages) as three effective dimensions of the distribution of budgetary resources (acquisition budget) is presented in Figure 5.
To optimally allocate resources (acquisition budget) by province and based on the major dimensions of each province, the budget allocation model is designed as follows:
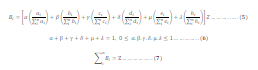
Equation 5 shows the share of each province's acquisition budget from the country's budget, which is calculated as a simple weighted sum function. In this equation:
Bi the amount of budget of province i, development factor of province i (to obtain the value of this index, the VIKOR decision-making model must be used, so that the value of Q obtained in this model must be added to the value of 1 and the obtained value is considered as the development index), bi population factor of province i, ci area factor of province i, di factor of the number of the township of province i, ei factor of the number of the city of province i, hi factor of the number of villages in province i, Z amount of budget considered for distribution in the provinces.
To involve the opinion of planners and experts in budget allocation and to create different budget distribution scenarios, coefficients according to Equation 6 were considered based on this formula:
α coefficient of expertise: development index,
β coefficient of expertise: population,
γ coefficient of expertise: area,
δ coefficient of expertise: number of townships,
μ coefficient of expertise: number of cities,
λ coefficient of expertise: number of villages.
The sum of these coefficients must be equal to one, and to weight the coefficients, weighting methods such as Shannon entropy, AHP, ANP, OPA, etc. methods can be used. According to Equation 7, the total amount of estimated budgets should be the same as the number of budgets considered for distribution.
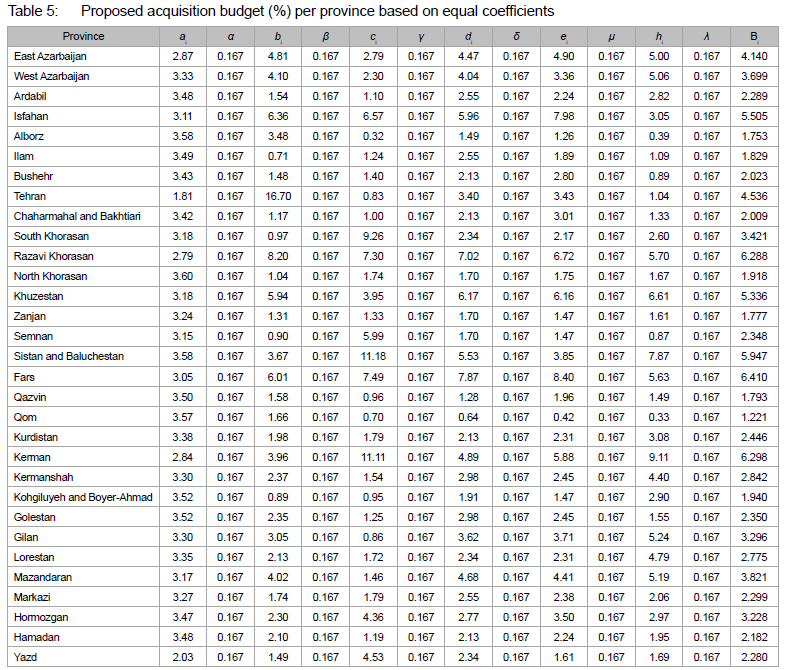
To optimally present the acquisition budget in Iran, based on the 2 proposed scenarios (equal coefficients and AHP coefficients), the allocation of budgets for each province will be determined and compared based on the actuaI share in 2021. In this article, the AHP multi-criteria decision-making weighting method is used with a purposeful snowball sampling method and with a sample size of 10 experts (see Equation 6). In this regard, the proposed acquisition budgeting Bi (%) has been evaluated in two ways, based on equal coefficients and based on AHP coefficients, and the results of this evaluation are shown in Tables 5 and 6.
As shown in Table 5, equal weighting was applied to each index, with a coefficient value of 0.167 assigned uniformly. The evaluation results indicate that Fars Province received the highest share of the acquisition budget at 6.410%, while Qom Province received the lowest at 1.221%. Table 6 further illustrates that, under the assumption of equal coefficients, regional inequality in budget allocation appears to have decreased over time. This trend suggests that a more equitable distribution of acquisition budget resources can contribute to greater regional balance and reduced disparities.
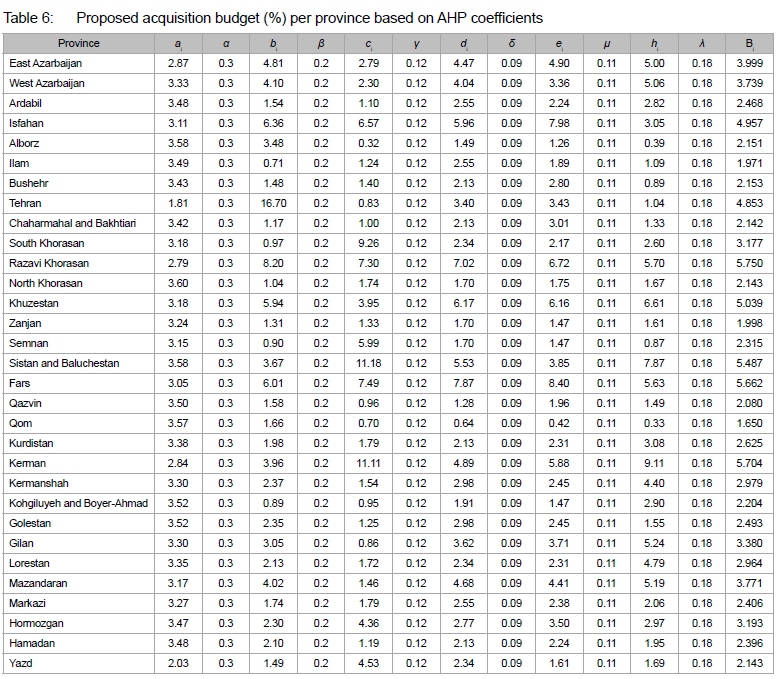
As shown in Table 6, the weights assigned to each coefficient were determined based on expert opinions (see Equation 6) and calculated according to the share of each indicator for each province. In Table 6, the development index coefficient is the highest at 0.3, followed by the population coefficient at 0.2, the area coefficient at 0.12, the number of townships coefficient at 0.09, the number of cities coefficient at 0.11, and the number of villages coefficient at 0.18. The results presented in Table 6 reveal that Razavi Khorasan Province, with an acquisition budget percentage of 5.750%, received the highest allocation, while Qom Province, with 1.620%, received the lowest.
After evaluating the acquisition budget percentages for each of the scenarios, the differences between the 2021 acquisition budget and those proposed in the scenarios were analysed. The results of this comparison are presented in Table 7.
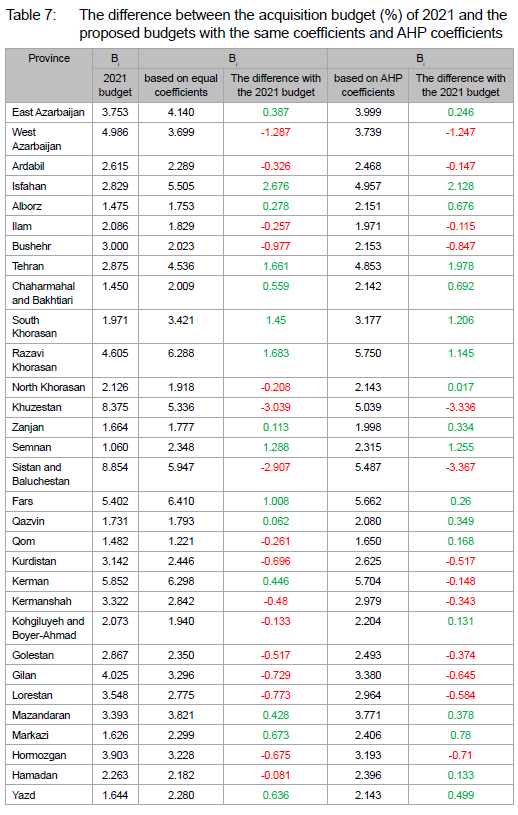
Using the proposed budget allocation model, two methods, namely equal coefficients and AHP coefficients, were applied to the variables influencing budgetary resource allocation. The resulting percentage of acquisition budget across Iran's provinces was then compared to the actual acquisition budget percentages for 2021. The findings presented in Table 7 indicate a significant difference between the budget allocations generated by the two proposed methods.
Finally, to assess the effectiveness of the proposed model, the coefficient of variation (CV) was used to evaluate the distribution of the budgets. The results of this evaluation are shown in Table 8.

As shown in Table 8, the coefficient of variation (CV) for both the equal coefficients method (0.487) and the AHP coefficients method (0.405) is lower than the CV value for the 2021 budget. This indicates that, under the proposed model, provinces would experience a more equitable allocation compared to the 2021 distribution. This suggests that implementing the acquisition budgeting distribution based on this model could be effective in reducing both regional and intra-regional inequalities, thereby promoting spatial justice across Iran's territorial areas. In addition, the less-developed provinces, through their share of the acquisition budget, could better harness their natural and human resources, as well as other territorial potentials, to foster development and improve the welfare of residents in these regions.
6. DISCUSSION
This study examined the changes in the development levels of Iran's provinces from 2011 to 2021. The findings reveal that provinces Tehran, Yazd, Kerman, and Razavi Khorasan have the highest development status. Among these, Tehran serves as a central pole of development, aligning with the neoclassical economic theory and the center-periphery model. Due to Tehran's political centrality, along with the accumulation of services and resources, the province has attracted skilled human resources and investors. This centralisation has not only contributed to an imbalance in the spatial distribution of services but also exacerbated population concentration in Tehran. Similar findings have been reported in previous studies (Mosayyebzadeh et al., 2022; Abbasi Taghi Dizej & Pashazadeh, 2021; Ahmadi et al., 2020; Rahmani Fazli et al., 2019).
The study highlights significant regional disparities across Iran's provinces from 2011 to 2021, as evidenced by the coefficient of variation (CV). These disparities have led to the emergence of development poles, with Tehran and Yazd acting as the primary development hubs. This trend is consistent with the findings of earlier studies (Mosayyebzadeh et al., 2022; Abbasi Taghi Dizej & Pashazadeh, 2021; Ahmadi et al., 2020; Rahmani Fazli et al., 2019; Karimi Moughari & Barati, 2017; Rahimibadr, 2013; Ibrahimzadeh et al., 2012). Despite government efforts to allocate more development budgets to border provinces in recent decades, these initiatives have had minimal impact on reducing regional inequalities. Consequently, central provinces continue to experience higher levels of development, while border provinces remain underdeveloped, unless the government adopts more serious, balanced development strategies.
The study also indicates that budget distribution across provinces between 2011 and 2021 has been inconsistent, contributing to uneven growth. The CV values reveal that the budget allocation is unbalanced and erratic, underscoring the need for a more equitable distribution. As noted by Ghaffary Fard and Shojaei (2020), the lack of fairness in budget distribution is a fundamental issue that undermines government efforts to address regional disparities.
To address regional inequalities and ensure a more just distribution of budgetary resources, this study proposes a model (Figure 4) that incorporates three key dimensions, namely development indicators (economic, social, and infrastructure), territorial characteristics (population and area), and territorial divisions (number of townships, cities, and villages). This model offers several advantages for promoting balanced development. First, it establishes eligibility criteria for budget distribution that consider various factors such as development indicators, territorial features, and divisions, thereby correcting the existing, unplanned budget distribution. Secondly, the model allows for the assignment of weights to different indicators based on expert opinions, which can gradually reduce regional inequality. For example, provinces with lower development levels may qualify for higher budget allocations, helping to balance development over time. Thirdly, while the model is tailored for Iran, it is also applicable to other developing countries facing similar regional inequalities.
A country's budget is a vital tool for implementing economic, social, and political policies (Ghasemy et al., 2015) and for supporting justice and human development (Ghaffary Fard & Shojaei, 2020).
However, research shows that, in Iran, government policies often lack a targeted approach to addressing inequalities through budget allocation (Jamshidi et al., 2017). Consequently, a disproportionate share of budgetary resources is directed toward central provinces, perpetuating regional disparities. This imbalance hampers economic growth in neighbouring provinces, increases migration, and exacerbates inequality (Vafae Bakyani, Mashhadiahmad & Mehrara 2019).
7. CONCLUSION AND RECOMMENDATIONS
This study has revealed significant inter-provincial disparities in Iran, rooted primarily in an opaque and imbalanced system of budgetary planning and resource distribution. Tehran province, benefiting from its central political and administrative position, has emerged as the dominant growth pole - absorbing a disproportionate share of physical, economic, social resources, and political influence. As a result, provinces such as Tehran and Yazd exhibit high levels of development, whereas peripheral and border provinces remain underdeveloped.
The spatial development pattern of Iran clearly reflects a center-periphery structure, underlining the pressing need for a more balanced planning system. Addressing these disparities necessitates a shift towards territorially informed, indicator-based planning and investment. The model proposed in this study offers a framework for equitable and sustainable budget allocation, aligning resource distribution with the unique characteristics and development indicators of each province.
By adopting this model, Iran can move toward achieving the objectives of the UN's 2030 Sustainable Development Agenda. Balanced development across provinces not only supports national cohesion, but also strengthens the overall trajectory of social and economic progress. The current centralised planning paradigm, influenced by growth pole and neoclassical economic theories, has contributed to deepening inequalities, particularly between central and border provinces. A new approach, grounded in fairness and data-driven planning, is essential for long-term, inclusive growth.
To reduce regional inequalities and ensure the optimal allocation of budgetary resources, the following policy recommendations are proposed for Iran:
• Targeted budget support for underdeveloped provinces: Provinces identified in the lowest development cluster, particularly North Khorasan, Sistan and Baluchistan, and Alborz, require special budgetary allocations aimed at improving development indicators and achieving regional balance.
• Adoption of the proposed model: The observed discrepancies between actual 2021 acquisition budgeting and model-based projections demonstrate that current budgeting practices overlook territorial features and development metrics. Implementing the proposed model would significantly enhance the fairness and effectiveness of resource allocation.
• Creation of a national development indicator database: In the short term, it is recommended to establish a comprehensive databank detailing key development indicators for all provinces. This would facilitate evidence-based decision-making and enable the ranking of provinces according to development needs.
• Mid- and long-term evaluation: Authorities should apply the proposed model to guide the distribution of financial resources and conduct mid- and long-term evaluations, in order to assess its effectiveness and adjust policies accordingly.
• Addressing poverty and social welfare deficiencies: Immediate attention should be paid to provinces facing severe poverty and low social welfare, especially in border areas. Tailored programmes should be implemented to reduce disparities in these regions.
• Leveraging local potential: Short-term strategies should focus on identifying and using each province's specific strengths and capacities to improve local economies and social well-being, especially in port and border provinces.
• Review of regional balance programmes: Medium-term efforts should involve a critical review and evaluation of existing national and regional spatial planning programmes to ensure that they are aligned with the goals of equitable development.
• Long-term decentralisation strategy: A national strategy should be developed to decentralise economic and population activities, particularly addressing the over-concentration in Tehran. This could help redistribute opportunities and resources more evenly across the country.
Achieving optimal budget distribution in Iran requires a data-driven approach that prioritises three core dimensions, namely territorial features, territorial divisions, and development indicators. A shift away from politically motivated allocations toward evidence-based, regionally sensitive planning is vital for balanced and inclusive national development.
One limitation of this study is the reliance on the most recent available data, which dates back to 2021, as published by the ISC. The unavailability of more current data may influence the precision of the model's outputs. Future research can enhance the model's relevance and accuracy, by incorporating newly released data as it becomes available.
REFERENCES
ABBASI TAGHI DIZEJ, R. & PASHAZADEH, A. 2021. Identifying the factors affecting regional inequality in Iran. Geography and Territorial Spatial Arrangement, 11(41), pp. 25-50. https://doi.org/10.22111/gaij.2021.6573 [ Links ]
AFRAKHTEH, H. 2006. The problems of regional development and border cities: A case study of Zahedan, Iran. Cities, 23(6), pp. 423-432. https://doi.org/10.1016/j.cities.2006.08.004 [ Links ]
AHMADI, M., FALAHATI, A. & DELANGIZAN, S. 2020. Transition dynamic analysis of the regional disparity in Iran (Case study: Iran provinces). Quarterly Journal of Quantitative Economics, 17(1), pp. 85-119. https://doi.org/10.22055/jqe.2019.27789.1984 [ Links ]
AMANPOUR, S. & MOHAMMADI, C. 2021. An analysis of spatial distribution of development and regional inequalities in Ilam province. Regional Planning, 11(42), pp. 102-117. DOI: 10.30495/jzpm.2021.4210 [ Links ]
AMIRAHMADI, H. 1986. Regional planning in Iran: A survey of problems and policies. Journal of Developing Areas, 20(4), pp. 501-530. http://www.jstor.org/stable/4191491 [ Links ]
BAYRAMZADEH, N. & MOUSAVI, M.N. 2024. Investigating the relationship between development and resource allocation in the creation of new human settlements during the years 2011 to 2021 (Case study: Iran). Journal of Geography and Environmental Studies, 13(49), pp. 120-139. https://sanad.iau.ir/Journal/ges/Article/1107624 [ Links ]
CAPELLO, R. 2015. Regional economics. London, UK: Routledge. https://doi.org/10.4324/9781315720074 [ Links ]
CAPELLO, R. & CERISOLA, S. 2023. Industrial transformations and regional inequalities in Europe. Annals of Regional Science, 70(1), pp. 15-28. https://doi.org/10.1007/s00168-021-01097-4 [ Links ]
CAPUNO, J.J. 2022. Growth with redistribution, finally: Regional poverty and inequality in the Philippines, 2000-2018. Asia and the Global Economy, 2(2). https://doi.org/10.1016/j.aglobe.2022.100039 [ Links ]
CASTREE, N., KITCHIN, R. & ROGERS, A. 2013. Oxford dictionary of human geography. Oxford Quick Reference. Oxford University Press. https://doi.org/10.1093/acref/9780199599868.001.0001 [ Links ]
CHATTERJEEA, P. & CHAKRABORTY, P. 2016. A comparative analysis of VIKOR method and its variants. Decision Science Letters, 5, pp. 469-486. https://doi.org/10.5267/j.dsl.2016.5.004 [ Links ]
ÇINAR, i.T. 2023. Regional development trap and economic complexity in Turkey: Evidence from provincial data. Regional Science Policy & Practice, 15(9), pp. 2224-2253. https://doi.org/10.1111/rsp3.12719 [ Links ]
CÖRVERS, F. & MAYHEW, K. 2021. Regional inequalities: Causes and cures. Oxford Review of Economic Policy, 37(1), pp. 1-16. Https://doi.org/10.1093/oxrep/graa067 [ Links ]
DARWENT, D.F. 1969. Growth poles and growth centers in regional planning: A review. Environment and Planning, 1, pp. 5-32. https://doi.org/10.1068/a010005 [ Links ]
DA SILVA, S.A. 2021. An effort to define regional inequalities in the contemporary world. Mercator, 20. https://doi.org/10.4215/rm2021.e20019 [ Links ]
DEHGHAN SHABANI, Z., HADIAN, E. & NEGAHDARI, J. 2019. Analysis of the relationship between regional inequality and economic development in Iran: Spatial dynamic panel data approach. Journal of Economic Research, 54(4), pp. 875-890. https://doi.org/10.22059/jte.2019.74169 [ Links ]
DIAZ-BAUTISTA, A. & ANDRADE, S. 2014. The debate of the modern theories of regional economic growth. RA XIMHAI, 10, pp. 187-206. https://doi.org/10.35197/rx.10.03.e2.2014.14.ad [ Links ]
DUNFORD, M. 2009. Regional inequalities. International Encyclopedia of Human Geography, 9, pp. 236-245. https://doi.org/10.1016/B978-008044910-4.00874-9 [ Links ]
ENFLO, K., ALVAREZ-PALAU, E. & MARTI-HENNEBERG, J. 2018. Transportation and regional inequality: The impact of railways in the Nordic countries, 1860-1960. Journal of Historical Geography, 62, pp. 51-70. https://doi.org/10.1016/j.jhg.2018.05.001 [ Links ]
ESKANDARI ATA, M.R., MEHREGAN, N., POURFARAJ, A. & KARIMI PETANLAR, S. 2020. Spatial analyses of regional inequality with emphasis on environmental and political factors. Journal of Economics and Regional Development, 26(18), pp. 197-220. https://doi.org/10.22067/erd.v26i18.72081 [ Links ]
FOTROS, M.H. & FATEMI ZARDAN, Y. 2020. Comparative comparison of the development process and the inequality of provinces of the country in the periods of 1380, 1390, and 1395: The core-periphery approach. Journal of Applied Economics Studies in Iran, 9(35), pp. 63-89. DOI: 10.22084/aes.2020.20138.2942 [ Links ]
GHAFFARY FARD, M. & SHOJAEI, M.R. 2020. Investigation of the performance of budget distribution between different provinces of Iran according to their capacity and needs during the first and last years of the tenth and eleventh government. QJFEP, 7(28), pp. 111-143. http://qjfep.ir/article-1-1045-en.html [ Links ]
GHASEMY, M.R., ARBABIAN, S., MOEENI, S. & SALIMI, B. 2015. Analysis of the distribution assets acquisition of capital budget in State of Iran (1379-1390). The Journal of Planning and Budgeting, 20(1), pp. 37-66. https://jpbud.ir/article-1-1078-fa.html [ Links ]
HASSANI, M., SAMERI, M., SEYEDABBASZADEH, M.& MOUSAVI, M. 2013. Surveying educational inequalities among female and male high school students in Western Azerbaijan Province. Woman In Development & Politics, 11(3), pp. 315-332. https://doi.org/10.22059/jwdp.2013.36531 [ Links ]
HEKMATNIYA, H. & MOUSAVI, M.N. 2006. The application of model in geography emphasizing urban and regional planning. Yazd: Elmenovin Publication. [ Links ]
HIRSCHMAN, A. 1958. The strategy of economic development. Ekonomisk Tidskrift. 61. https://doi.org/10.2307/3438684 [ Links ]
IAMMARINO, S., RODRIGUEZ-POSE, A. & STORPER, M. 2019. Regional inequality in Europe: Evidence, theory and policy implications. Journal of Economic Geography, 19(2), pp. 273-298. https://doi.org/10.1093/jeg/lby021 [ Links ]
IBRAHIMZADEH, I., MOUSAVI, M.N. & KAZEMIZAD, S. 2012. Spatial analysis of regional disparities between the central and border areas of Iran. Geopolitics Quarterly, 8(25), pp. 214-235. https://journal.iag.ir/article_56080.html?lang=en [ Links ]
JAMSHIDI, R., SALIMIFAR, M., AHMADI SHADMEHRI, M. & GHORBANI, M. 2017. Impact of share of the agricultural sector on distribution provincial constructive budget: Using spatial regression. Journal of Agricultural Economics and Development, 31(2), pp. 136-148. https://doi.org/10.22067/jead2.v31i2.59482 [ Links ]
JIANG, Y. & SHI, C. 2023. Estimating sustainability and regional inequalities using an enhanced sustainable development index in China. Sustainable Cities and Society, 99(3), article 104555. https://doi.org/10.1016/j.scs.2023.104555 [ Links ]
KARIMI MOUGHARI, Z. & BARATI, J. 2017. Determining the level of regional inequality in provinces of Iran: Analysis of multidimensional composite index. Economic Growth and Development Research, 7(26), pp. 49-70. https://egdr.journals.pnu.ac.ir/article_2592.html?lang=en [ Links ]
LI, Y. & WU, H. 2012. A clustering method based on K-means algorithm. Physics Procedia, 25, pp. 1104-1109. https://doi.org/10.1016/j.phpro.2012.03.206 [ Links ]
LIU, H., WANG, X., WANG, Z. & CHENG, Y. 2024. Does digitalization mitigate regional inequalities? Evidence from China. Geography and Sustainability, 5(1), pp. 52-63. https://doi.org/10.1016/j.geosus.2023.09.007 [ Links ]
MOSAYYEBZADEH, A., MOZAFARI NIYA, A. & SHABESTAR, M. 2022. Analysis of spatial inequalities and assessing of regional development statuses in the provinces of Iran. Journal of Geography, Urban and Regional Studies, 10(40), pp. 71-84. https://ges.iaun.iau.ir/article_684741.html?lang=en [ Links ]
MOUSAVI, M., & BAYRAMZADEH, N. 2024. Spatial analysis of the trend of regional inequalities in Iran. Scientific-Research Quarterly of Geographical Data (SEPEHR), 33(131), pp. 105-125. DOI: 10.22131/ sepehr.2024.2017054.3039 [ Links ]
MOUSAVI, M., JAFARPOUR GHALEHTEIMOURI, K., BAGHERI KASHKOULI, A. & BAYRAMZADEH, N. 2024. Mitigating development barriers and addressing disparities in border cities of Iran: A comprehensive analysis of border provinces and influential factors. Geojournal, 89(4), pp. 1-20. https://doi.org/10.1007/s10708-024-11181-9 [ Links ]
NOORBAKHSH, F. 2003. The dynamics of spatial inequality and polarisation in Iran. Working Papers 2003_17, Business School - Economics, University of Glasgow, Scotland. https://doi.org/10.2139/ssrn.482481 [ Links ]
OPRICOVIC, S. & TZENG, G.-H. 2004. Compromise solution by MCDM methods: A comparative analysis of VIKOR and TOPSIS. European Journal of Operational Research, 156(2), pp. 445-455. https://doi.org/10.1016/S0377-2217(03)00020-1 [ Links ]
OPRICOVIC, S. & TZENG, G.-H. 2007. Extended VIKOR method in comparison with outranking methods. European Journal of Operational Research, 178(2), pp. 514-529. https://doi.org/10.1016/j.ejor.2006.01.020 [ Links ]
PERROUX, F. 1955. Note sur la notion de pole de croissance? Economic Appliqee, pp. 61, 307-320. https://doi.org/10.3406/ecoap.1955.2522 [ Links ]
POURFARAJ, A., MEHREGAN, N., KARIMI POTANLAR, S. & ESKANDARIATA, M.R. 2019. Regional inequality in Iran and the impact of economic factors: A spatial econometric approach. Iranian Economic Review, 23(2), pp. 297-318. https://doi.org/10.22059/ier.2019.70279 [ Links ]
RAHIMIBADR, B. 2013. Estimating the Lorenz curves using alternative parametric models. The case of Iranian rural and urban population. Economic Strategy, 2(4), pp. 95-120. https://econrahbord.csr.ir/article_103229.html?lang=en [ Links ]
RAHMANI FAZLI, H., NIKBAKHT, S. & MOLABAHRAMI, A. 2019. The effect of the budget on regional inequality of Iran using panel spatial econometrics model. Economic Research and Policies, 27(89), pp. 399-430. http://qjerp.ir/article-1-1835-fa.html [ Links ]
SABBAGHI, M. 2020. Inequality of rural income distribution in Iran: An exploratory analysis of spatial data. Cuadernos de Desarrollo Rural, 17, pp. 1-17. https://doi.org/10.11144/Javeriana.cdr17.irid [ Links ]
SALEHI-ISFAHANI, D. 2017. Poverty and income inequality in the Islamic Republic of Iran. Revue internationale des études du développement, (1), pp. 113-136. https://www.cairn.info/revue-internationale-des-etudes-du-developpement-2017-1-page-113.htm. https://doi.org/10.3917/ried.229.0113 [ Links ]
SALEM, A.A., JAHANGARD, E. & JABARI, L. 2021. The factors affecting health inequality in Iran provinces. Economic Research and Policies, 29(99), pp. 385-417. https://qjerp.ir/browse.php?a_id=3051&sid=1&slc_lang=en&ftxt=0. https://doi.org/10.52547/qjerp.29.99.385 [ Links ]
SHANNON, C.E. 1948. A mathematical theory of communication. Bell System Technical Journal, 27(3), pp. 379-423. https://doi.org/10.1002/j.1538-7305.1948.tb01338.x [ Links ]
SCI (Statistical Center of Iran). n.d. The yearbook of Iran. [Online]. Available at: https://www.amar.org.ir/en/Statistics-by-Topic/Environment-and-multi-domain-statistics/Yearbooks-and-similar-compendia/Yearbook [Accessed: 24 March 2024]. [ Links ]
TAYLOR, A., GREEN, A., MATSU, J., O'FARRELL, L., READ, H., COE, G., BRITTAIN, B. & BRAMLEY, G. 2022. Investing in regional equality: Lessons from four cities. Chartered Institute of Public Finance and Accountancy (CIPFA). [ Links ]
TEYMOORI, R. 2019. Investigating the impact of growth poles on regional economic activities. Hidden Economy, 4(15), pp. 79-101. https://hem.epe.ir/article_101843.html?lang=fa [ Links ]
TURKASHVAND, S., MINAEI NEZHAD, M., MORADIYAN MOHAMADIEH, V. & HASHEMI, F. 2022. Investigating the role of virtual education in reproducing educational inequality in the Corona. Roshd -e- Fanavari, 69(18), pp. 46-55. https://doi.org/10.52547/jstpi.20979.18.69.46 [ Links ]
VAFAE BAKYANI, H., MASHHADIAHMAD, M. & MEHRARA, M. 2019. Investigating the effect of budget shocks on economic growth of provinces in terms of distribution of inter-provincial credits. Journal of Econometric Modelling, 4(2), pp. 9-32. https://www.sid.ir/paper/380732/en [ Links ]
WEI, Y. 2015. Spatiality of regional inequality. Appl. Geogr., 61, pp. 1-10. https://doi.org/10.1016/j.apgeog.2015.03.013 [ Links ]
WEI, Y., WU, Y., LIAO, F. & ZHANG, L. 2020. Regional inequality, spatial polarization and place mobility in provincial China: A case study of Jiangsu province. Appl. Geogr, 124. https://doi.org/10.1016/j.apgeog.2020.102296 [ Links ]
ZEBARDAST, E. & HAGHROOSTA, S. 2017. Typology of theoretical and empirical approaches on regional disparities. Journal of Architecture and Urban Planning, 10(19), pp. 153-169. DOI: 10.30480/aup.2017.543 [ Links ]
ZHANG, X., LU, Y., XU, Y., ZHOU, C. & ZOU, Y. 2024. Governing regional inequality through regional cooperation? A case study of the Guangdong-Hong Kong-Macau Greater Bay area. Applied Geography, 162. https://doi.org/10.1016/j.apgeog.2023.103135 [ Links ]
Received: December 2024
Peer reviewed and revised: April 2025
Published: June 2025
* The author(s) declared no potential conflicts of Interest with respect to the research, authorship, and/or publication of this article
1 The phrase 'territorial advancement trap' is not widely recognised in standard literature, but it can refer to situations where a group or entity, in an effort to expand its territory or influence, over-extends itself and faces negative consequences.